SOMEONE HELP! :(
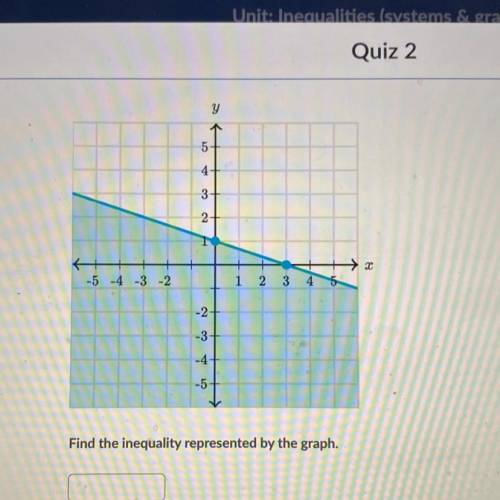
Find the inequality represented by the graph
...

Mathematics, 18.03.2021 03:30 glowbaby123
SOMEONE HELP! :(
Find the inequality represented by the graph

Answers: 2


Another question on Mathematics
Mathematics, 21.06.2019 17:00
The table shows population statistics for the ages of best actor and best supporting actor winners at an awards ceremony. the distributions of the ages are approximately bell-shaped. compare the z-scores for the actors in the following situation. best actor best supporting actor muequals42.0 muequals49.0 sigmaequals7.3 sigmaequals15 in a particular year, the best actor was 59 years old and the best supporting actor was 45 years old. determine the z-scores for each. best actor: z equals best supporting actor: z equals (round to two decimal places as needed.) interpret the z-scores. the best actor was (more than 2 standard deviations above more than 1 standard deviation above less than 1 standard deviation above less than 2 standard deviations below) the mean, which (is not, is) unusual. the best supporting actor was (less than 1 standard deviation below more than 1 standard deviation above more than 2 standard deviations below more than 1 standard deviation below) the mean, which (is is not) unusual.
Answers: 1
Mathematics, 21.06.2019 18:00
Galen sold tickets of his church’s carnival for a total of $2,820. children’s tickets cost $3 each and adult tickets cost $5 each. the number of children’s tickets sold was 30 more than 3 times the number of adult tickets slod. how many children’s ticket and how many adult tickets did he sell?
Answers: 2
Mathematics, 21.06.2019 18:30
The table shows the relationship between the number of cups of cereal and the number of cups of raisins in a cereal bar recipe: number of cups of cereal number of cups of raisins 8 2 12 3 16 4 molly plotted an equivalent ratio as shown on the grid below: a graph is shown. the title of the graph is cereal bars. the horizontal axis label is cereal in cups. the x-axis values are 0, 20, 40, 60, 80,100. the vertical axis label is raisins in cups. the y-axis values are 0, 10, 20, 30, 40, 50. a point is plotted on the ordered pair 40,20. which of these explains why the point molly plotted is incorrect? (a) if the number of cups of cereal is 40, then the number of cups of raisins will be10. (b)if the number of cups of raisins is 40, then the number of cups of cereal will be10. (c) if the number of cups of cereal is 40, then the number of cups of raisins will be 80. (d) if the number of cups of raisins is 40, then the number of cups of cereal will be 80.
Answers: 1
You know the right answer?
Questions

Physics, 20.07.2021 06:10

English, 20.07.2021 06:10
Mathematics, 20.07.2021 06:10
Mathematics, 20.07.2021 06:10
Mathematics, 20.07.2021 06:10

Social Studies, 20.07.2021 06:10
English, 20.07.2021 06:10
English, 20.07.2021 06:10
Mathematics, 20.07.2021 06:10
Mathematics, 20.07.2021 06:10
Mathematics, 20.07.2021 06:10

Advanced Placement (AP), 20.07.2021 06:10
Physics, 20.07.2021 06:10


