Mathematics, 18.03.2021 03:30 mayachojnicki
The graph shows the value of a certain model of car compared with its age.
Which statement is true?
A. The correlation coefficient is close to 0.
B. The data show a negative linear relationship.
C. The car's age is not correlated to its value.
D. The car's age is the response variable.

Answers: 2


Another question on Mathematics

Mathematics, 21.06.2019 22:50
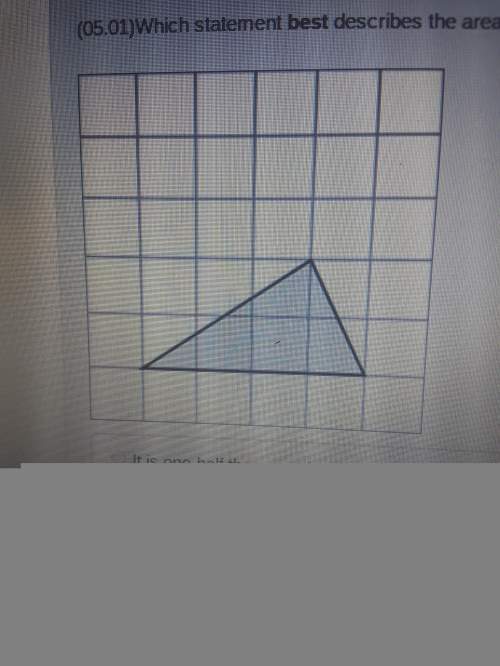
Which best explains why this triangle is or is not a right triangle ?
Answers: 2

Mathematics, 22.06.2019 03:00
Aplane is flying at 32,500 feet. it needs to rise to 36,000 feet in two stages.• in stage 1, it rises 5% of its initial altitude of 32,500 feet.• in stage 2, it rises at a rate of 125 feet per minute.how many minutes does it take for the plane to rise during stage 2?
Answers: 1

Mathematics, 22.06.2019 04:00
The graph below represents which system of inequalities? a. y< -2x+6 y< (or equal to) x+2 b. y< (or equal to) -2x+6 y c. y< 2/3 x - 2 y> (or equal to) 2x +2 d. none of the above
Answers: 2

Mathematics, 22.06.2019 05:30
What does the pair of equations y = 1, z = 8 represent? in other words, describe the set of points (x, y, z) such that y = 1 and z = 8?
Answers: 3
You know the right answer?
The graph shows the value of a certain model of car compared with its age.
Which statement is true?...
Questions

Mathematics, 23.01.2021 18:30

Biology, 23.01.2021 18:30

Mathematics, 23.01.2021 18:30

Mathematics, 23.01.2021 18:30


Mathematics, 23.01.2021 18:30

Spanish, 23.01.2021 18:30


English, 23.01.2021 18:30

History, 23.01.2021 18:30


Mathematics, 23.01.2021 18:30


Mathematics, 23.01.2021 18:30

Mathematics, 23.01.2021 18:30

English, 23.01.2021 18:30


