
Mathematics, 18.03.2021 16:40 tatia65
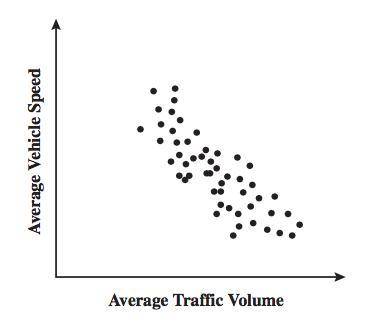
The scatter plot below shows the average traffic volume and average vehicle speed on a certain freeway for 50 days in 1999.
Which statement best describes the relationship between average traffic volume and average vehicle speed shown on the scatter plot?
As traffic volume increases, vehicle speed increases at first, then decreases.
As traffic volume increases, vehicle speed decreases at first, then increases.
As traffic volume increases, vehicle speed increases.
As traffic volume increases, vehicle speed decreases

Answers: 1


Another question on Mathematics
Mathematics, 21.06.2019 19:00
Billy plotted −3 4 and −1 4 on a number line to determine that −3 4 is smaller than −1 4 is he correct? explain why or why not?
Answers: 3
Mathematics, 21.06.2019 20:10
Acolony contains 1500 bacteria. the population increases at a rate of 115% each hour. if x represents the number of hours elapsed, which function represents the scenario? f(x) = 1500(1.15)" f(x) = 1500(115) f(x) = 1500(2.15) f(x) = 1500(215)
Answers: 3
Mathematics, 22.06.2019 02:30
Wow i want to vacation in mexico jeremih wow old vacation in mexico jeremiah we read read reads a distance marker that indicates he is 89 km from juarez if 1 mile approximately 1.61 km how far is jeremiah from juarez
Answers: 1
You know the right answer?
The scatter plot below shows the average traffic volume and average vehicle speed on a certain freew...
Questions

Mathematics, 16.12.2019 06:31


Biology, 16.12.2019 06:31
History, 16.12.2019 06:31

Chemistry, 16.12.2019 06:31

Health, 16.12.2019 06:31
History, 16.12.2019 06:31
English, 16.12.2019 06:31
History, 16.12.2019 06:31
Mathematics, 16.12.2019 06:31
Mathematics, 16.12.2019 06:31
Mathematics, 16.12.2019 06:31


