
Mathematics, 18.03.2021 17:20 xodees
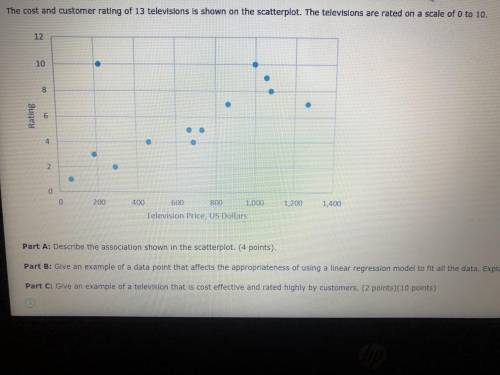
The cost and customer rating of 13 televisions is shown on the scatter plot. The televisions are rated on a scale of 0 to 10.
Part A: Describe the association shown in the scatter plot.
Part B: Give an example of a data point that affects the appropriateness of using a linear regression model to fit all the data. Explain.
Part C: Give example of a television that is cost effective and rated highly by customers.
*picture shown

Answers: 2


Another question on Mathematics
Mathematics, 21.06.2019 15:00
Given the choice between receiving $1.000.000 in one month or a single penny-doubled everyday for the period of one month; which option would you choice? show your work to support your answer. (assume that 1 month=30 days)
Answers: 1
Mathematics, 21.06.2019 17:00
Somone me i want to know what 18 hours out of 24 hours in a fraction
Answers: 1
Mathematics, 21.06.2019 18:30
Can someone check if i did this right since i really want to make sure it’s correct. if you do you so much
Answers: 2
Mathematics, 21.06.2019 20:00
Given the graphed function below which of the following orders pairs are found on the inverse function
Answers: 1
You know the right answer?
The cost and customer rating of 13 televisions is shown on the scatter plot. The televisions are rat...
Questions
Mathematics, 23.03.2021 05:30

Business, 23.03.2021 05:30

Spanish, 23.03.2021 05:30

English, 23.03.2021 05:30
Mathematics, 23.03.2021 05:30
English, 23.03.2021 05:30

Social Studies, 23.03.2021 05:30
Mathematics, 23.03.2021 05:30
Mathematics, 23.03.2021 05:30


Biology, 23.03.2021 05:30
English, 23.03.2021 05:30
Mathematics, 23.03.2021 05:30


