
Mathematics, 18.03.2021 17:50 rene27
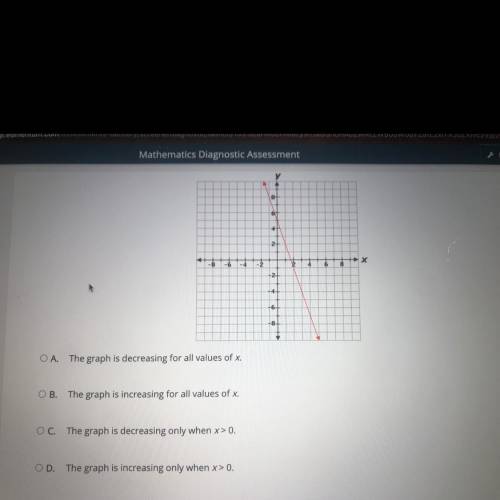
Describe the behavior of the graph below.
A. The graph is decreasing for all values of x.
B.
The graph is increasing for all values of x.
C.
The graph is decreasing only when x > 0.
D.
The graph is increasing only when x > 0.

Answers: 2


Another question on Mathematics
Mathematics, 21.06.2019 21:20
Find the missing variable for a parallelogram: a = latex: 28in^2 28 i n 2 h = b = 6.3 in (1in=2.54cm)
Answers: 3
Mathematics, 21.06.2019 21:20
What is the area of a triangle with vertices at (-3 3) (-3,2) and (1,2)?
Answers: 1
Mathematics, 21.06.2019 23:30
The area (a) of a circle with a radius of r is given by the formula and its diameter (d) is given by d=2r. arrange the equations in the correct sequence to rewrite the formula for diameter in terms of the area of the circle.
Answers: 1
Mathematics, 22.06.2019 00:00
Two poles, ab and ed, are fixed to the ground with the of ropes ac and ec, as shown: what is the approximate distance, in feet, between the two poles? 6.93 feet 8.66 feet 12.32 feet 15.59 feet
Answers: 1
You know the right answer?
Describe the behavior of the graph below.
A. The graph is decreasing for all values of x.
Questions

History, 11.02.2021 07:10

Arts, 11.02.2021 07:10

English, 11.02.2021 07:10


Chemistry, 11.02.2021 07:10
Mathematics, 11.02.2021 07:10
Mathematics, 11.02.2021 07:10


Mathematics, 11.02.2021 07:10
History, 11.02.2021 07:10


