Mathematics, 18.03.2021 21:30 geometryishard13
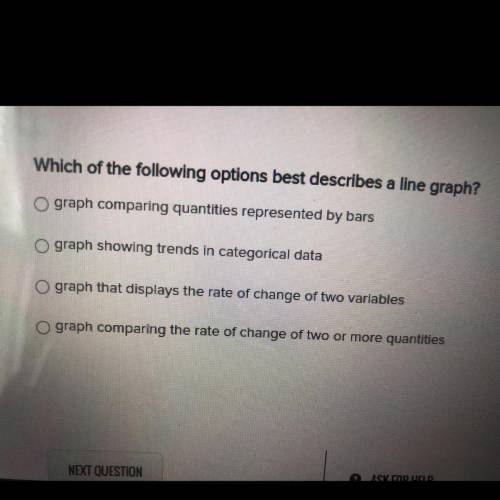
Which of the following options best describes a line graph?
O graph comparing quantities represented by bars
graph showing trends in categorical data
graph that displays the rate of change of two variables
graph comparing the rate of change of two or more quantities
Help me please


Answers: 1


Another question on Mathematics

Mathematics, 21.06.2019 15:00
Which value of c would make he following expression completely factored? 8x+cy
Answers: 1


Mathematics, 21.06.2019 18:00
Identify which functions are linear or non-linear. a. f(x) = x2 + 1 b. f(x) = 2x + 5 c. f(x) = x 2 + 3 d. f(x) = 3 x + 7 e. f(x) = 4x + 10 2 - 5
Answers: 1

Mathematics, 21.06.2019 19:30
Look at this pattern ; 1,4,9, number 10000 belongs in this pattern . what’s the place of this number?
Answers: 1
You know the right answer?
Which of the following options best describes a line graph?
O graph comparing quantities represente...
Questions


Mathematics, 03.05.2021 20:30

Mathematics, 03.05.2021 20:30


English, 03.05.2021 20:30


Mathematics, 03.05.2021 20:30

Business, 03.05.2021 20:30

Mathematics, 03.05.2021 20:30

Mathematics, 03.05.2021 20:30


Health, 03.05.2021 20:30


Mathematics, 03.05.2021 20:30

Mathematics, 03.05.2021 20:30


