The graph displays the recorded speeds of a truck over certain time intervals.
60
50
40...

Mathematics, 19.03.2021 01:00 bhadd2001
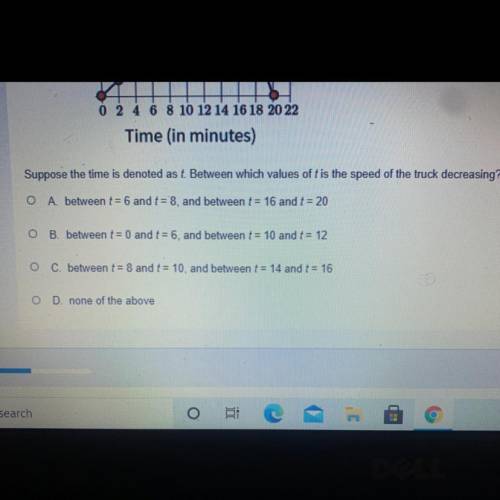
The graph displays the recorded speeds of a truck over certain time intervals.
60
50
40
30
Speed of Truck
(in miles per hour)
20
0 2 6 8 10 12 14 16 18 20 22
Time (in minutes)
Suppose the time is denoted ast Between which values oft is the speed of the truck decreasing?

Answers: 1


Another question on Mathematics
Mathematics, 21.06.2019 13:40
Which compound inequality can be used to solve the inequality 3x+2 > 7? -7 < 3x+2> 7 -7> 3x+27 3x + 2 > -7 or 3x + 2 > 7 3x + 2 < -7 or 3x + 2 > 7
Answers: 1
Mathematics, 21.06.2019 17:00
Given f(x)=2x^2-8x+6 and g(x)=3x-1 find f(x) +g(x) a. 2x^2+5x+5 b.2x^2-11x+7 c. 2x^2-5x+5 d.2x^2-5x-5
Answers: 1
Mathematics, 21.06.2019 19:00
Identify the conclusion of the conditional statement. if you live in phoenix, then you live in arizona.
Answers: 1
You know the right answer?
Questions

Mathematics, 16.10.2020 03:01

English, 16.10.2020 03:01

Social Studies, 16.10.2020 03:01

Physics, 16.10.2020 03:01
Social Studies, 16.10.2020 03:01
Physics, 16.10.2020 03:01

History, 16.10.2020 03:01
History, 16.10.2020 03:01
English, 16.10.2020 03:01
English, 16.10.2020 03:01


Biology, 16.10.2020 03:01
History, 16.10.2020 03:01

Geography, 16.10.2020 03:01


