
Mathematics, 19.03.2021 04:10 eaves001
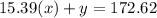
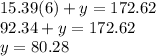
A painter charges $15.39 per hour, plus an additional amount for the supplies. If he made $172.62 on a job where he worked 6 hours, how much did the supplies cost?

Answers: 1


Another question on Mathematics
Mathematics, 21.06.2019 16:20
Ivan began dividing g2 – 6 by g + 1, noting that . he started by placing g in the quotient, as shown below.what is g2 – 6 divided by g + 1? g – 1 – g + 1 – g – 7 + g – 5 +
Answers: 3
Mathematics, 21.06.2019 21:30
Ahypothesis is: a the average squared deviations about the mean of a distribution of values b) an empirically testable statement that is an unproven supposition developed in order to explain phenomena a statement that asserts the status quo; that is, any change from what has been c) thought to be true is due to random sampling order da statement that is the opposite of the null hypothesis e) the error made by rejecting the null hypothesis when it is true
Answers: 2
Mathematics, 22.06.2019 00:30
Anew test for ra is being developed. the test is administered to 750 patients with ra and 750 without ra. for the sake of the question, assume the prevalence of ra in this population is 50%. of the 750 patients with ra, 575 have a positive result. of the 750 patients without ra, 150 have a positive result. what is the positive predictive value of the new test? a575/(575+150) b. 600/(600+ 150) c. 575/(575+125) d. 600/(600+ 125)
Answers: 2
Mathematics, 22.06.2019 03:00
Describe how the presence of possible outliers might be identified on the following. (a) histograms gap between the first bar and the rest of bars or between the last bar and the rest of bars large group of bars to the left or right of a gap higher center bar than surrounding bars gap around the center of the histogram higher far left or right bar than surrounding bars (b) dotplots large gap around the center of the data large gap between data on the far left side or the far right side and the rest of the data large groups of data to the left or right of a gap large group of data in the center of the dotplot large group of data on the left or right of the dotplot (c) stem-and-leaf displays several empty stems in the center of the stem-and-leaf display large group of data in stems on one of the far sides of the stem-and-leaf display large group of data near a gap several empty stems after stem including the lowest values or before stem including the highest values large group of data in the center stems (d) box-and-whisker plots data within the fences placed at q1 â’ 1.5(iqr) and at q3 + 1.5(iqr) data beyond the fences placed at q1 â’ 2(iqr) and at q3 + 2(iqr) data within the fences placed at q1 â’ 2(iqr) and at q3 + 2(iqr) data beyond the fences placed at q1 â’ 1.5(iqr) and at q3 + 1.5(iqr) data beyond the fences placed at q1 â’ 1(iqr) and at q3 + 1(iqr)
Answers: 1
You know the right answer?
A painter charges $15.39 per hour, plus an additional amount for the supplies. If he made $172.62 on...
Questions


History, 01.03.2021 21:20

English, 01.03.2021 21:20
Mathematics, 01.03.2021 21:20
Mathematics, 01.03.2021 21:20

Mathematics, 01.03.2021 21:20

English, 01.03.2021 21:20
Mathematics, 01.03.2021 21:20

World Languages, 01.03.2021 21:20


