
Mathematics, 19.03.2021 04:30 fermaluis8015
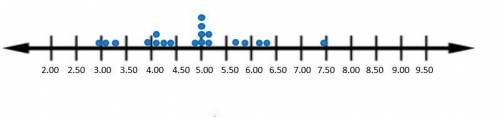
The owner of a new coffee shop is keeping track of how much each customer spends (in dollars). A random number table was used to generate a random sample of 20 pieces of data. The dot plot below shows the twenty pieces of data. Based on the data in the dot plot, what would you expect the mean of the sample to be? EXPLAIN YOUR REASONING.

Answers: 3


Another question on Mathematics
Mathematics, 21.06.2019 12:40
Question 13 of 451 pointwhich statement correctly describes the inverse of the following function? a. it is negative.b. it is a horizontal shift.c. it is not a function.d. it is a function. give an explanation as to why you chose that answer. (i think its either a or d.)
Answers: 1
Mathematics, 21.06.2019 22:00
Using inductive reasoning, what are the next two number in this set? 2,3/2,4/3,5/4,
Answers: 1
Mathematics, 22.06.2019 04:00
The length of a rectangle is 2 inches more than twice it’s width. if the perimeter of the rectangle is 70 inches,find it’s length and width
Answers: 1
Mathematics, 22.06.2019 04:00
The label on a can of lemonade gives the volume as 12 fl 0z or 355ml verify that these two measurements are nearly equivalent
Answers: 1
You know the right answer?
The owner of a new coffee shop is keeping track of how much each customer spends (in dollars). A ran...
Questions
Mathematics, 31.08.2019 22:30

History, 31.08.2019 22:30

Biology, 31.08.2019 22:30

History, 31.08.2019 22:30
History, 31.08.2019 22:30

Business, 31.08.2019 22:30


Geography, 31.08.2019 22:30
Mathematics, 31.08.2019 22:30
Mathematics, 31.08.2019 22:30

Social Studies, 31.08.2019 22:30
Mathematics, 31.08.2019 22:30


