
Mathematics, 19.03.2021 19:20 hinacat87
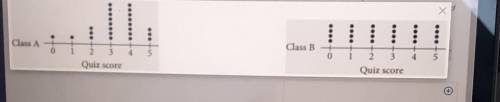
The dot plots below show the distributions of scores on a current events quiz for two classes of 24 students. Write a description of the standard deviation of the scores in each of the classes. Based on the spread of the data, which class performed better on the quiz.

Answers: 3


Another question on Mathematics
Mathematics, 21.06.2019 22:00
The numbers on a football field indicate 10 yard increments. you walk around the perimeter of a football field between the pylons. you walk a distance of 30623 yards. find the area and perimeter of the indicated regions. write your answers as mixed numbers, if necessary. a. one end zone: perimeter: yd area: yd2 b. the playing field (not including end zones): perimeter: yd area: yd2 c. the playing field (including end zones): perimeter: yd area: yd2
Answers: 1
Mathematics, 22.06.2019 00:10
Change negative exponents to positive. then solve. round to four decimal places
Answers: 3
Mathematics, 22.06.2019 03:50
One x-intercept for a parabola is at the point (1,0). use the factor method to find x-intercept for the parabola defined by the equation y=-3x^2+5x+2
Answers: 1
Mathematics, 22.06.2019 06:00
The sequence of transformations that can be performed on quadrilateral abcd to show that it is congruent to quadrilateral ghij is a followed by a .
Answers: 1
You know the right answer?
The dot plots below show the distributions of scores on a current events quiz for two classes of 24...
Questions


Social Studies, 15.12.2020 21:40

Spanish, 15.12.2020 21:40

Arts, 15.12.2020 21:40
Mathematics, 15.12.2020 21:40
Mathematics, 15.12.2020 21:40
Arts, 15.12.2020 21:40

Geography, 15.12.2020 21:40
Mathematics, 15.12.2020 21:40
Mathematics, 15.12.2020 21:40

Chemistry, 15.12.2020 21:40
English, 15.12.2020 21:40
Mathematics, 15.12.2020 21:40
Mathematics, 15.12.2020 21:40
Mathematics, 15.12.2020 21:40
Mathematics, 15.12.2020 21:40


