
Mathematics, 19.03.2021 20:30 calvarado12
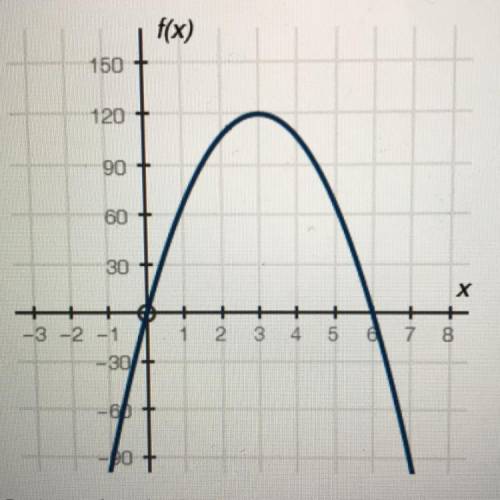
The graph below shows a company's profit f(x), in dollars, depending on the price of goods x, in dollars, being sold by the
company:
Part A: What do the x-intercepts and maximum value of the graph represent?
Part B: What are the intervals where the function is increasing and decreasing, and what do they represent about the sale and profit?
Part C: What is an approximate average rate of change of the graph from x = 1 to x = 3, and what does this rate represent?

Answers: 3


Another question on Mathematics
Mathematics, 21.06.2019 14:00
Question 1(multiple choice worth 1 points)(07.06 mc)a group of students must collect at least $150 to organize a science fair. they have already collected $30. which graph best represents all remaining amounts of money, in dollars, that thestudents should still collect to organize the science fair? -210 -180 -150 - 120 -90-60 -300306090 120 150 180 210-210 -180 -150 - 120 -90 -60 -30 0 30 60 90 120 150 180 210-210 -180-150 - 120 -90-60-300 30 60 90 120 150 180 210-210 -180 -150 - 120.90 -60 -30 0 30 60 90 120 150 180 210
Answers: 3
Mathematics, 22.06.2019 01:00
You went to a restaurant and spent $53.25 on the meal. there was a 6% sales tax. what was the amount of money, not including a tip, you spent at the restaurant?
Answers: 1
Mathematics, 22.06.2019 02:30
In one month jillian made 36 local phone calls and 20 long-distance calls what was her ratio of local calls to long-distance calls for that month?
Answers: 1
You know the right answer?
The graph below shows a company's profit f(x), in dollars, depending on the price of goods x, in dol...
Questions
Mathematics, 19.05.2021 19:50

Physics, 19.05.2021 19:50


Mathematics, 19.05.2021 19:50
Mathematics, 19.05.2021 19:50
Mathematics, 19.05.2021 19:50


Arts, 19.05.2021 19:50
Mathematics, 19.05.2021 19:50
Mathematics, 19.05.2021 19:50

History, 19.05.2021 19:50
Mathematics, 19.05.2021 19:50


