Mathematics, 19.03.2021 20:40 Derrielle6451
Unit 6 Statistics Test SY 2020-2021 / 14 of 17
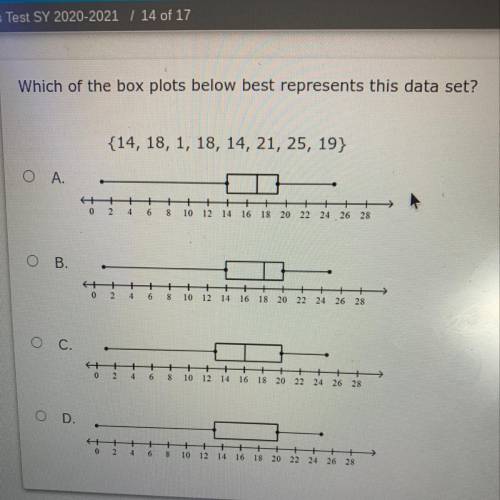
Which of the box plots below best represents this data set?
{14, 18, 1, 18, 14, 21, 25, 19}
Ο Α.
>
O
10 12 14 16 18 20 22 24 26 28
О В
.
8 10 12 14 16 18
20 22 24 26 28
OC.
영
!
10 12 14 16 18 20 22 24 26 28
C D
10 12 14 16 18 20 22 24 26 28


Answers: 3


Another question on Mathematics

Mathematics, 21.06.2019 16:30
What is the difference between regular convex and concave polygons
Answers: 1

Mathematics, 21.06.2019 17:00
There is a spinner with 14 equal areas, numbered 1 through 14. if the spinner is spun one time, what is the probability that the result is a multiple of 2 or a multiple of 5?
Answers: 2

Mathematics, 21.06.2019 17:30
What is not true about kl and mn? what is mn? (show your work)
Answers: 1

Mathematics, 21.06.2019 17:50
On a string instrument, the length of a string varies inversely as the frequency of its vibrations. an 11-inch string has a frequency of 400 cylces per second. find the frequency of a 10-icnch string.
Answers: 2
You know the right answer?
Unit 6 Statistics Test SY 2020-2021 / 14 of 17
Which of the box plots below best represents this da...
Questions

Mathematics, 04.03.2021 14:00

Mathematics, 04.03.2021 14:00

Mathematics, 04.03.2021 14:00


Mathematics, 04.03.2021 14:00

English, 04.03.2021 14:00

History, 04.03.2021 14:00

Mathematics, 04.03.2021 14:00


Mathematics, 04.03.2021 14:00


Mathematics, 04.03.2021 14:00


