
Mathematics, 20.03.2021 07:00 kayranicole1
Please help fast
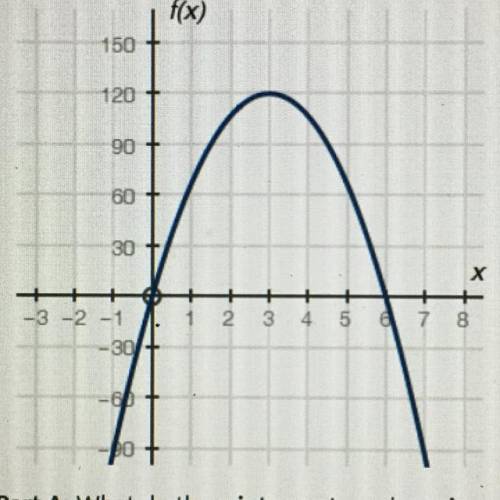
The graph below shows a company's profit f(x), in dollars, depending on the price of goods x, in dollars, being sold by the
company:
Part A: What do the x-intercepts and maximum value of the graph represent?
prefent? ?
Part B: What are the intervals where the function is increasing and decreasing, and what do they represent about the sale and
profit?
Part C: What is an approximate average rate of change of the graph from x = 1 to x = 3, and what does this rate represent?

Answers: 2


Another question on Mathematics
Mathematics, 21.06.2019 19:30
Asurvey of 2,000 doctors showed that an average of 3 out of 5 doctors use brand x aspirin.how many doctors use brand x aspirin
Answers: 1
Mathematics, 21.06.2019 20:30
What is the difference between the equations of a vertical and a horizontal line?
Answers: 2
Mathematics, 21.06.2019 21:50
6x + 3y = -6 2x + y = -2 a. x = 0, y = -2 b. infinite solutions c. x = -1, y = 0 d. no solution
Answers: 1
You know the right answer?
Please help fast
The graph below shows a company's profit f(x), in dollars, depending on the price...
Questions


English, 14.01.2020 17:31
English, 14.01.2020 17:31
English, 14.01.2020 17:31
Mathematics, 14.01.2020 17:31
English, 14.01.2020 17:31

Geography, 14.01.2020 17:31

English, 14.01.2020 17:31


Chemistry, 14.01.2020 17:31
Geography, 14.01.2020 17:31
English, 14.01.2020 17:31


