
Mathematics, 21.03.2021 09:30 Amber423
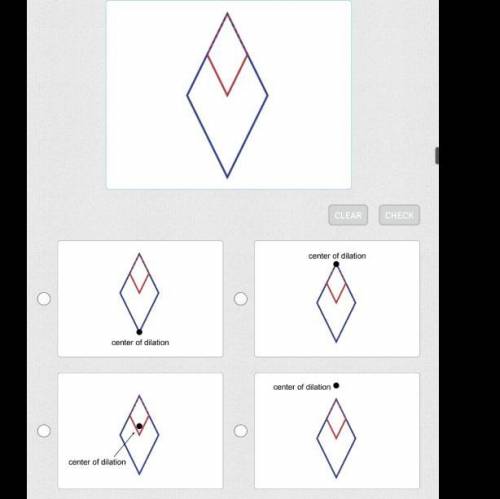
The red figure is a dilation of the blue figure. Which diagram shows the correct center of dilation?

Answers: 2


Another question on Mathematics
Mathematics, 21.06.2019 18:00
Suppose sat writing scores are normally distributed with a mean of 497 and a standard deviation of 109. a university plans to award scholarships to students whose scores are in the top 2%. what is the minimum score required for the scholarship? round your answer to the nearest whole number, if necessary.
Answers: 2
Mathematics, 22.06.2019 00:00
Table of values relation g values x, y 2,2 /3,5 /4,9 /5,13 which ordered pair is in g inverse? a(-2,2) b(-3,-5) c)4,9) d( 13,5)
Answers: 3
Mathematics, 22.06.2019 01:30
Use the linear combination method to solve the system of equations. explain each step of your solution. if steps are not explained, you will not receive credit for that step. 2 + 9 = −26 −3 − 7 = 13
Answers: 2
Mathematics, 22.06.2019 04:30
How many zeroes do we write when we write all the integers 1 to 243 in base 3?
Answers: 1
You know the right answer?
The red figure is a dilation of the blue figure. Which diagram shows the correct center of dilation?...
Questions

English, 14.10.2019 17:20

Arts, 14.10.2019 17:20

English, 14.10.2019 17:20
Mathematics, 14.10.2019 17:20


Chemistry, 14.10.2019 17:20

History, 14.10.2019 17:30
Chemistry, 14.10.2019 17:30


