
Mathematics, 22.03.2021 06:40 janai9852
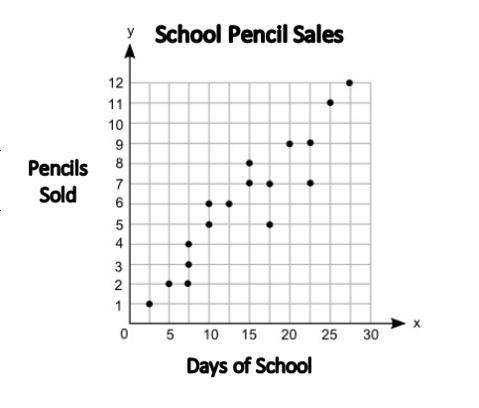
Shana created the graph below that presents the relationship between the number of pencils sold and the number of days in school:
Part A: In your own words, tell me about the relationship between the number of days in school and the number of pencils sold. (5 points)
Part B: Tell me how you would make the line of best fit on this graph. Find the approximate slope and y-intercept of the line of best fit and tell me what they are. Show me the steps you took to find the slope, including the points that you used to calculate slope. (5 points)

Answers: 3


Another question on Mathematics
Mathematics, 21.06.2019 16:30
If g(x) is an odd function, which function must be an even function?
Answers: 3
Mathematics, 21.06.2019 21:40
The point a is at –2 and the point b is at 7. marissa would like to divide this line segment in a 4: 3 ratio, and she would like to use the formula x = (x2 – x1) + x1. what values should she substitute into the formula? a = a + b = x1 = x2 =
Answers: 2
You know the right answer?
Shana created the graph below that presents the relationship between the number of pencils sold and...
Questions
Mathematics, 24.07.2019 18:30

Mathematics, 24.07.2019 18:30


Mathematics, 24.07.2019 18:30
Biology, 24.07.2019 18:30

Health, 24.07.2019 18:30
Health, 24.07.2019 18:30
Mathematics, 24.07.2019 18:30


