Mathematics, 22.03.2021 17:50 msitez5993
Help asap!
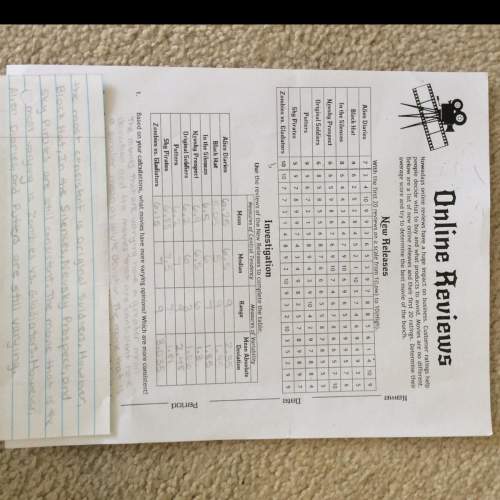
Dot plot A is the top plot. Dot plot B is the bottom plot. According to the dot plots, which statement is true?
The mean of the data in dot plot A is less than the mean of the data in data plot B.
The mode of the data in dot plot A is less than the mode of the data in dot plot B.
The median of the data in dot plot A is greater than the median of the data in dot plot B.
The range of the data in dot plot A is greater than the range of the data in dot plot B.

Answers: 3


Another question on Mathematics

Mathematics, 21.06.2019 22:00
Worth 100 points need the answers asap first row -x^2 2x^2 (x/2)^2 x^2 x is less than 2 x is greater than 2 x is less than or equal to 2 x is greater than or equal to 2 second row -5 -5/2 4 5 •2 is less than x& x is less than 4 •2 is less than or equal to x & x is less than or equal to 4 •2 is less than or equal to x& x is less than 4 •2 is less than x& x is less than or equal to 4
Answers: 2

Mathematics, 21.06.2019 22:30
Nicole is making carrot bread she needs 5 cups of carrots for 2 cups of sugar.what is the ratio of cups of sugar to cups of carrots that nicole will need? write the ration in three different ways
Answers: 1

Mathematics, 22.06.2019 00:00
Charlie is at an amusement park that has 18 different rides. each ride costs $1.75. the function c(r) = 1.75r represents the total amount of money that charlie will spend if he goes on r rides, but he never goes on the same one more than once. what domain and range are reasonable for the function?
Answers: 3

Mathematics, 22.06.2019 01:30
Given are five observations for two variables, x and y. xi 1 2 3 4 5 yi 3 7 5 11 14 which of the following is a scatter diagrams accurately represents the data? what does the scatter diagram developed in part (a) indicate about the relationship between the two variables? try to approximate the relationship betwen x and y by drawing a straight line through the data. which of the following is a scatter diagrams accurately represents the data? develop the estimated regression equation by computing the values of b 0 and b 1 using equations (14.6) and (14.7) (to 1 decimal). = + x use the estimated regression equation to predict the value of y when x = 4 (to 1 decimal). =
Answers: 3
You know the right answer?
Help asap!
Dot plot A is the top plot. Dot plot B is the bottom plot. According to the dot plots, w...
Questions

Mathematics, 29.11.2020 14:00

Mathematics, 29.11.2020 14:00

English, 29.11.2020 14:00

English, 29.11.2020 14:00

Mathematics, 29.11.2020 14:00

English, 29.11.2020 14:00


Mathematics, 29.11.2020 14:00


Mathematics, 29.11.2020 14:00

Physics, 29.11.2020 14:00


Physics, 29.11.2020 14:00

Mathematics, 29.11.2020 14:00


