
Mathematics, 22.03.2021 21:50 eemorales5100
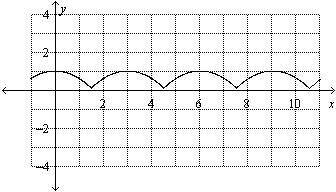
Use the given graph. Determine the period of the function.
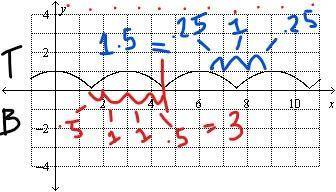
( - Sort of Confused on the periods, would I find it using the bottom or top periods? Because it would be different answers whether is would be top or bottom. )
- - With It being Top Period it would be 1.5 - And with it being Bottom Period it would be 3.
Select one:
a. 6
b. 1.5
c. -0.9
d. 3

Answers: 2


Another question on Mathematics
Mathematics, 21.06.2019 14:40
The physical fitness of an athlete is often measured by how much oxygen the athlete takes in (which is recorded in milliliters per kilogram, ml/kg). the mean maximum oxygen uptake for elite athletes has been found to be 60 with a standard deviation of 7.2. assume that the distribution is approximately normal.
Answers: 3
Mathematics, 21.06.2019 23:30
Is the underlined participial phrase correctly placed or misplaced? i smelled each and every flower strolling through the garden. a. correctly placed participial phrase b. misplaced participial phrase
Answers: 2
Mathematics, 22.06.2019 00:00
Heather is a cashier. she can ring up 1212 customers in 99 minutes. at this rate, how many minutes does it take her to ring up 44 customers?
Answers: 1
Mathematics, 22.06.2019 02:00
1. the manager of collins import autos believes the number of cars sold in a day (q) depends on two factors: (1) the number of hours the dealership is open (h) and (2) the number of salespersons working that day (s). after collecting data for two months (53 days), the manager estimates the following log-linear model: q 4 equation 1 a. explain, how to transform the log-linear model into linear form that can be estimated using multiple regression analysis. the computer output for the multiple regression analysis is shown below: q4 table b. how do you interpret coefficients b and c? if the dealership increases the number of salespersons by 20%, what will be the percentage increase in daily sales? c. test the overall model for statistical significance at the 5% significance level. d. what percent of the total variation in daily auto sales is explained by this equation? what could you suggest to increase this percentage? e. test the intercept for statistical significance at the 5% level of significance. if h and s both equal 0, are sales expected to be 0? explain why or why not? f. test the estimated coefficient b for statistical significance. if the dealership decreases its hours of operation by 10%, what is the expected impact on daily sales?
Answers: 2
You know the right answer?
Use the given graph. Determine the period of the function.
( - Sort of Confused on the periods, wou...
Questions


Mathematics, 11.11.2020 23:00
Mathematics, 11.11.2020 23:00

English, 11.11.2020 23:00

Geography, 11.11.2020 23:00
History, 11.11.2020 23:00
History, 11.11.2020 23:00
Biology, 11.11.2020 23:00

Social Studies, 11.11.2020 23:00

Chemistry, 11.11.2020 23:00


