PLEEEASE HELP!
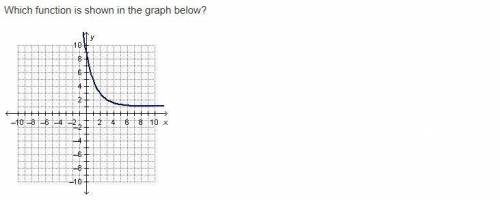
Which function is shown in the graph below?
y = (one-half) Superscript x...

Mathematics, 22.03.2021 23:50 KaleahV
PLEEEASE HELP!
Which function is shown in the graph below?
y = (one-half) Superscript x + 3 Baseline minus 1
y = (one-half) Superscript x minus 3 Baseline + 1
y = (one-half) Superscript x minus 1 Baseline + 3
y = (one-half) Superscript x + 1 Baseline minus 3

Answers: 3


Another question on Mathematics
Mathematics, 21.06.2019 12:40
The figure above shows the lengths of thesides of a rectangle in cm. find the valuesof x and y and then the area of the rectangle.sides: top= 3x - yleft= 3y + 4bottom= 2x + yright= 2x - 3 use both methods, elimination and substitution, if possible.
Answers: 1
Mathematics, 21.06.2019 13:30
125 tickets were sold for the jazz band concert for a total of $1,022. students tickets cost $6 each, and general admission tickets cost $10 each. how many of each kind of tickets were sold?
Answers: 1
Mathematics, 22.06.2019 02:30
According to a research study, parents with young children slept 6.4 hours each night last year, on average. a random sample of 18 parents with young children was surveyed and the mean amount of time per night each parent slept was 6.8. this data has a sample standard deviation of 0.9. (assume that the scores are normally distributed.) researchers conduct a one-mean hypothesis at the 5% significance level, to test if the mean amount of time parents with young children sleep per night is greater than the mean amount of time last year. the null and alternative hypotheses are h0: μ=6.4 and ha: μ> 6.4, which is a right-tailed test. the test statistic is determined to be t0=1.89 using the partial t-table below, determine the critical value(s). if there is only one critical value, leave the second answer box blank.
Answers: 3
Mathematics, 22.06.2019 03:00
12 3 4 5 6 7 8 9 10 time remaining 42: 01 ryan gathered data about the age of the different dogs in his neighborhood and the length of their tails. which best describes the strength of the correlation, and what is true about the causation between the variables?
Answers: 2
You know the right answer?
Questions
Mathematics, 17.06.2020 21:57

Mathematics, 17.06.2020 21:57

English, 17.06.2020 21:57


Physics, 17.06.2020 21:57
Mathematics, 17.06.2020 21:57

Health, 17.06.2020 21:57
Mathematics, 17.06.2020 21:57
English, 17.06.2020 21:57


