Mathematics, 23.03.2021 01:00 jhjhgjvygv
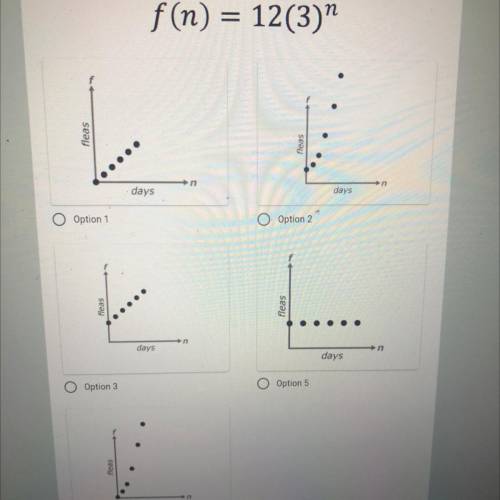
the number of fleas on Spot after he retuned from the park grew according to the function f(n)=12(3)n, where n is the number of days after returning from the dog park, and f(n) gives the number of fleas on Spot. Which graph best represents the relationship between n and f(n)?


Answers: 1


Another question on Mathematics

Mathematics, 21.06.2019 12:30
Write a recursive sequence that represents the sequence defined by the following explicit formula:
Answers: 1

Mathematics, 21.06.2019 14:30
Which of the following lines is parallel to x=4? a- 3y=9 b- y=4 c- x=2 d- x=y answer this as soon as possible xoxo lo ; )
Answers: 3

Mathematics, 21.06.2019 16:30
Brainlest answer can you find the area and circumference of a circle given the radius or diameter? if its yes or no explain why
Answers: 1

Mathematics, 21.06.2019 18:30
What can each term of the equation be multiplied by to eliminate the fractions before solving? x – + 2x = + x 2 6 10 12
Answers: 2
You know the right answer?
the number of fleas on Spot after he retuned from the park grew according to the function f(n)=12(3)...
Questions


Biology, 26.04.2021 20:40


Physics, 26.04.2021 20:40

Computers and Technology, 26.04.2021 20:40

Biology, 26.04.2021 20:40


History, 26.04.2021 20:40

Mathematics, 26.04.2021 20:40

Mathematics, 26.04.2021 20:40

Mathematics, 26.04.2021 20:40


