
Mathematics, 23.03.2021 03:30 alexiss7026
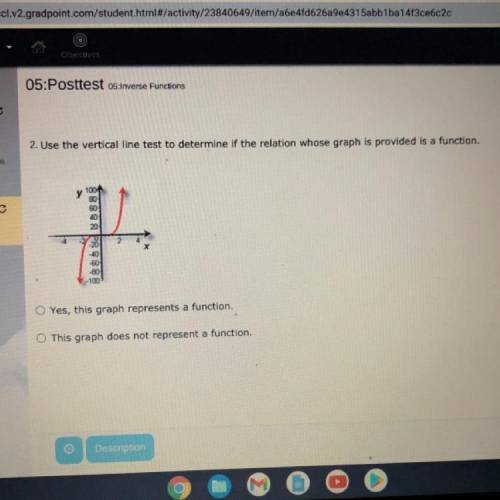
2. Use the vertical line test to determine if the relation whose graph is provided is a function.
y 1001
80
60
20
20
2
40
-60
80
.100
Yes, this graph represents a function.
This graph does not represent a function.

Answers: 2


Another question on Mathematics
Mathematics, 21.06.2019 14:30
Because of your favorite lemonade it is $3.84 for 3 gallons. write this as an unit rate
Answers: 2
Mathematics, 22.06.2019 02:30
Find a parametrization for the curve「and determine the work done on a particle moving along γ in r3 through the force field f: r^3--r^3'where f(x,y,z) = (1,-x,z) and (a) im (γ) is the line segment from (0,0,0) to (1,2,1) (b) im (γ) is the polygonal curve with successive vertices (1,0,0), (0,1,1), and (2,2,2) (c) im (γ) is the unit circle in the plane z = 1 with center (0,0,1) beginning and ending at (1,0,1), and starting towards (0,1,1)
Answers: 3
Mathematics, 22.06.2019 02:40
Arestaurant manager wanted to get a better understanding of the tips her employees earn, so she decided to record the number of patrons her restaurant receives over the course of a week, as well as how many of those patrons left tips of at least 15%. the data she collected is in the table below. day mon tue wed thu fri sat sun patrons 126 106 103 126 153 165 137 tippers 82 87 93 68 91 83 64 which day of the week has the lowest experimental probability of patrons tipping at least 15%? a. sunday b. saturday c. friday d. thursday
Answers: 1
You know the right answer?
2. Use the vertical line test to determine if the relation whose graph is provided is a function.
y...
Questions


Mathematics, 29.04.2021 18:10


Advanced Placement (AP), 29.04.2021 18:10
Mathematics, 29.04.2021 18:10


History, 29.04.2021 18:10

Mathematics, 29.04.2021 18:10
Mathematics, 29.04.2021 18:10
Biology, 29.04.2021 18:10
Mathematics, 29.04.2021 18:10


