
Mathematics, 23.03.2021 07:20 bry662
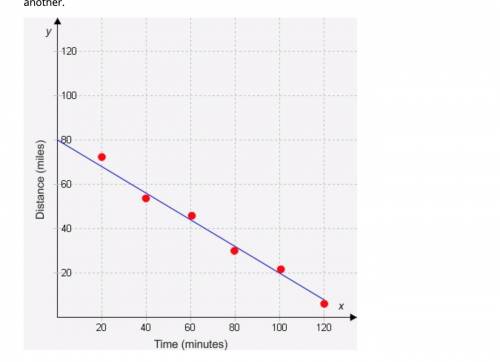
This scatter plot shows the association between the time elapsed and the distance remaining to travel when John drove from one city to another. John had a distance of about miles left after driving for 50 minutes. He will reach his destination in about minutes. Is the relationship for Camille’s puppy’s weight in terms of time linear or nonlinear? Explain your response.

Answers: 1


Another question on Mathematics
Mathematics, 21.06.2019 14:10
Can't gugys answer the ratio question. this is urgent the plans of a building is drawn toward scale of 1: 1000. kfc the foyer on the plans measures 62mm by 54mm, how large is the foyer in real life?
Answers: 1
Mathematics, 21.06.2019 18:00
Which shows the correct lengths of side c in both scales? scale 1: 45 m; scale 2: 60 m scale 1: 60 m; scale 2: 45 m scale 1: 36 m; scale 2: 27 m scale 1: 27 m; scale 2: 36 m mark this and return save and exit
Answers: 3
Mathematics, 21.06.2019 18:00
Jada has a monthly budget for her cell phone bill. last month she spent 120% of her budget, and the bill was 60$. what is jada’s monthly budget
Answers: 2
Mathematics, 21.06.2019 18:30
Anew shopping mall is gaining in popularity. every day since it opened, the number of shoppers is 5% more than the number of shoppers the day before. the total number of shoppers over the first 10 days is 1258 how many shoppers were on the first day?
Answers: 2
You know the right answer?
This scatter plot shows the association between the time elapsed and the distance remaining to trave...
Questions

English, 18.10.2020 21:01

History, 18.10.2020 21:01
Mathematics, 18.10.2020 21:01


Computers and Technology, 18.10.2020 21:01

Social Studies, 18.10.2020 21:01
English, 18.10.2020 21:01

Chemistry, 18.10.2020 21:01
Mathematics, 18.10.2020 21:01

Mathematics, 18.10.2020 21:01
English, 18.10.2020 21:01


Biology, 18.10.2020 21:01


