
Mathematics, 24.03.2021 09:40 tylorroundy
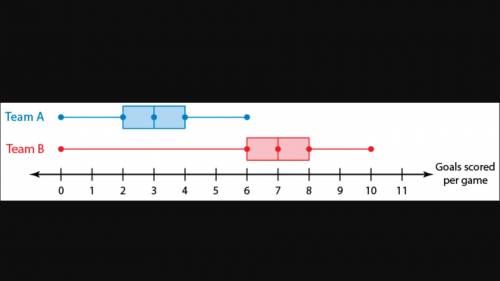
The double box-and-whisker plot shows the goals scored per game by two hockey teams during a 20-game season.
a. Compare the populations using measures of center and variation.
Team A: median = 3, IQR = 2
Team B: median = 7, IQR = 2
The variation in the goals scored is the same, but Team B usually scores about 4 more goals per game.
Team A: median = 3, IQR = 2
Team B: median = 7, IQR = 2
The variation in the goals scored differs by 4, but the number of goals scored per game is the same.
Team A: median = 6, IQR = 2
Team B: median = 10, IQR = 2
The variation in the goals scored is the same, but Team B usually scores about 4 more goals per game.
Team A: median = 6, IQR = 2
Team B: median = 10, IQR = 2
The variation in the goals scored differs by 4, but the number of goals scored per game is the same.
b. Express the difference in the measures of center as a multiple of the measure of variation.
The difference in the medians is (blank) times the IQR.

Answers: 1


Another question on Mathematics
Mathematics, 21.06.2019 19:30
If y varies directly as x2 and y=6 when x=6, find the constant of variation.
Answers: 2
Mathematics, 21.06.2019 20:00
Put the equation in slope intercept form by solving for y
Answers: 2
Mathematics, 21.06.2019 23:20
6cm10 cma conical paper cup has dimensions as shown in the diagram. how much water can the cup hold when full?
Answers: 1
Mathematics, 22.06.2019 01:00
Which graph shows the solution to the system of linear inequalities? y-4t< 4 y
Answers: 1
You know the right answer?
The double box-and-whisker plot shows the goals scored per game by two hockey teams during a 20-game...
Questions

Engineering, 14.02.2022 21:20


Mathematics, 14.02.2022 21:20
Mathematics, 14.02.2022 21:20

History, 14.02.2022 21:20

Biology, 14.02.2022 21:20
Mathematics, 14.02.2022 21:20

Advanced Placement (AP), 14.02.2022 21:20

Social Studies, 14.02.2022 21:20
History, 14.02.2022 21:20
Mathematics, 14.02.2022 21:20
Mathematics, 14.02.2022 21:20


