
Mathematics, 24.03.2021 22:50 dairysoto9171
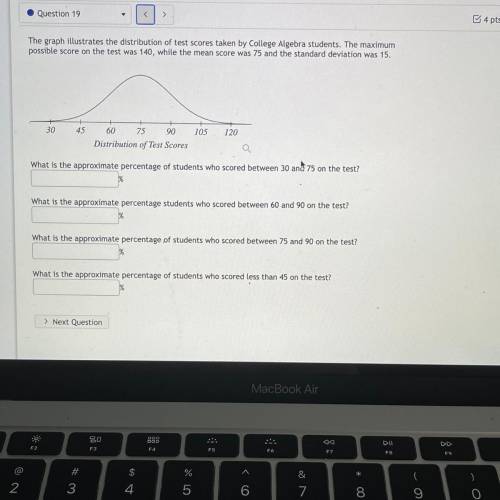
The graph illustrates the distribution of test scores taken by College Algebra students. The maximum
possible score on the test was 140, while the mean score was 75 and the standard deviation was 15.
30
45
105
120
60 75 90
Distribution of Test Scores
Q
What is the approximate percentage of students who scored between 30 and 75 on the test?
What is the approximate percentage students who scored between 60 and 90 on the test?
What is the approximate percentage of students who scored between 75 and 90 on the test?
What is the approximate percentage of students who scored less than 45 on the test?

Answers: 3


Another question on Mathematics
Mathematics, 21.06.2019 18:50
Find the center and the radius of the circle with the equation: x^2-2x+y^2+4y+1=0?
Answers: 1
Mathematics, 21.06.2019 19:00
The quadratic function h(t)=-16.1t^2+150 choose the graph representation
Answers: 1
Mathematics, 21.06.2019 19:30
Find the commission on a $590.00 sale if the commission is 15%.
Answers: 2
You know the right answer?
The graph illustrates the distribution of test scores taken by College Algebra students. The maximum...
Questions

History, 08.04.2020 17:24
History, 08.04.2020 17:24


English, 08.04.2020 17:24

Social Studies, 08.04.2020 17:24
Mathematics, 08.04.2020 17:24
History, 08.04.2020 17:24
Mathematics, 08.04.2020 17:24

Physics, 08.04.2020 17:24


Mathematics, 08.04.2020 17:24


