2.6
3.5
0.5
3.0
4.0
2.2
5.1
70
72
46
74
...

Mathematics, 25.03.2021 19:40 keananashville
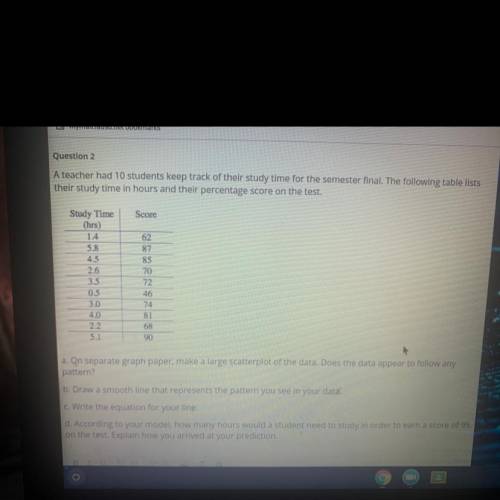
2.6
3.5
0.5
3.0
4.0
2.2
5.1
70
72
46
74
81
68
90
a. On separate graph paper, make a large scatterplot of the data. Does the data appear to follow any
pattern?
b. Draw a smooth line that represents the pattern you see in your data.
C. Write the equation for your line.
d. According to your model, how many hours would a student need to study in order to earn a score of
on the test. Explain how you arrived at your prediction.
BLUESOSTO
Unn
O

Answers: 1


Another question on Mathematics
Mathematics, 21.06.2019 23:00
What are two numbers that add up to -9 and multiply to -10 best answer gets branliest and 100 extra points
Answers: 1
Mathematics, 21.06.2019 23:30
What is the ratio for the surface areas of the cones shown below, given that they are similar and that the ratio of their radii and altitudes is 2: 1? submit
Answers: 1
Mathematics, 22.06.2019 01:00
Which number produces an irrational number multiplied by 1/3
Answers: 1
You know the right answer?
Questions

English, 21.05.2020 06:58


Mathematics, 21.05.2020 06:58

Geography, 21.05.2020 06:58
Mathematics, 21.05.2020 06:58
History, 21.05.2020 06:58
Geography, 21.05.2020 06:58
Mathematics, 21.05.2020 06:58
Biology, 21.05.2020 06:58


