
Mathematics, 25.03.2021 20:30 marissagirl4903
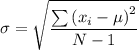
The following numbers represent the highest temperatures (in Fahrenheit) during the last 18 days of a city. 68, 75, 87 ,99, 72, 72, 65, 64, 61, 70, 77 ,70 ,67, 73, 83, 55, 58, 54 a. Calculate the mean, variance, and the standard deviation of the above data. b. Calculate the first quartile, the third quartile, and the 90th percentile. Interpret these values.

Answers: 1

 /N
/N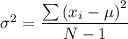


Another question on Mathematics
Mathematics, 21.06.2019 20:00
What are the domain and range of the function f(x)=2^x+1
Answers: 1
Mathematics, 21.06.2019 22:30
Gabrielle's age is two times mikhail's age. the sum of their ages is 84. what is mikhail's age?
Answers: 2
Mathematics, 22.06.2019 01:00
The correlation coefficient between the number of students and marks obtained in end semester exam. (13 marks) give the statistical meaning of the relationship between the number of students and marks b. obtained in end semester exam. (3 marks) draw the number of students and marks obtained in end semester exam scatter diagram c. (4 marks) check list write your name and id corectly write the question number properly use your own calculator. show all the steps to solve the problems. use the correct formula. answer in provided time. don't use your mobile for any purpose. write your answer up to two decimal places
Answers: 3
You know the right answer?
The following numbers represent the highest temperatures (in Fahrenheit) during the last 18 days of...
Questions

English, 01.09.2021 21:00
Mathematics, 01.09.2021 21:00

Mathematics, 01.09.2021 21:00
Mathematics, 01.09.2021 21:00
Mathematics, 01.09.2021 21:00
Mathematics, 01.09.2021 21:00
Mathematics, 01.09.2021 21:00
Mathematics, 01.09.2021 21:00
Mathematics, 01.09.2021 21:00

Mathematics, 01.09.2021 21:00
English, 01.09.2021 21:00


Chemistry, 01.09.2021 21:00
Mathematics, 01.09.2021 21:00


