
Mathematics, 26.03.2021 01:00 kassandramarie16
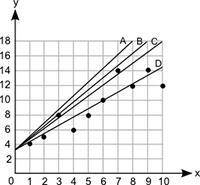
Which line best represents the line of best fit for this scatter plot? Graph shows numbers from 0 to 10 at increments of 1 on the x axis and numbers from 0 to 18 at increments of 2. Scatter plot shows ordered pairs 1, 4 and 2, 5 and 3, 8 and 4, 6 and 5, 8 and 6, 10 and 7, 14 and 8, 12 and 9, 14 and 10, 12. A line labeled A joins ordered pair 0, 3.2 and 8, 18. A line labeled B joins ordered pairs 0, 3.2 and 9, 18. A line labeled C joins ordered pairs 0, 3.2 and 10, 18. A line labeled D joins ordered pairs 0, 3.2 and 10, 14.2. Line A Line B Line C Line D

Answers: 3


Another question on Mathematics
Mathematics, 21.06.2019 16:10
Pls! does anybody know a shortcut for answering these types of questions in the future?
Answers: 3
Mathematics, 21.06.2019 16:30
One of the same side angles of two parallel lines is 20° smaller than the other one. find the measures of these two angles.
Answers: 3
Mathematics, 21.06.2019 18:30
Can someone check if i did this correct. it’s number 4 if you’re wondering.
Answers: 1
You know the right answer?
Which line best represents the line of best fit for this scatter plot? Graph shows numbers from 0 to...
Questions
Mathematics, 25.08.2020 02:01

Mathematics, 25.08.2020 02:01

English, 25.08.2020 02:01
Mathematics, 25.08.2020 02:01


Mathematics, 25.08.2020 02:01


Biology, 25.08.2020 02:01
Mathematics, 25.08.2020 02:01


Mathematics, 25.08.2020 02:01
Mathematics, 25.08.2020 02:01


