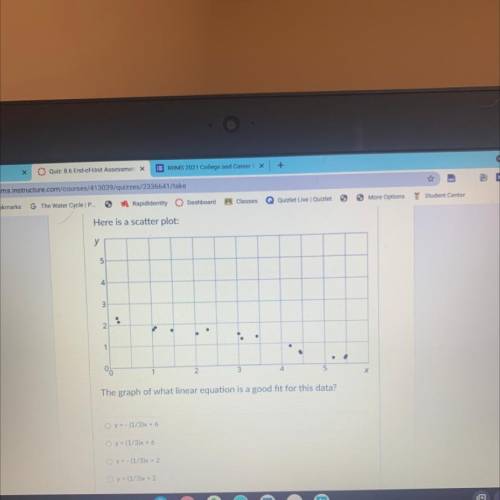
Here is a scatter plot:
у
un
5
4
3
2.
s
1
.
0...

Mathematics, 26.03.2021 17:10 11AnimalLover11
Here is a scatter plot:
у
un
5
4
3
2.
s
1
.
05
1
3
5
N
х
The graph of what linear equation is a good fit for this data?
O y = -(1/3)X + 6
O y = (1/3)x + 6
O y = - (1/3)x + 2
O y = (1/3)X + 2

Answers: 2


Another question on Mathematics
Mathematics, 21.06.2019 19:00
In a class, there are 12 girls. if the ratio of boys to girls is 5: 4 how many boys are there in the class
Answers: 1
Mathematics, 21.06.2019 20:30
Write the summation to estimate the area under the curve y = 1 + x2 from x = -1 to x = 2 using 3 rectangles and right endpoints
Answers: 1
You know the right answer?
Questions


English, 03.03.2022 08:20

Health, 03.03.2022 08:20
Mathematics, 03.03.2022 08:20


History, 03.03.2022 08:20
Social Studies, 03.03.2022 08:20
Business, 03.03.2022 08:20


