
Mathematics, 26.03.2021 18:30 natjojo0512
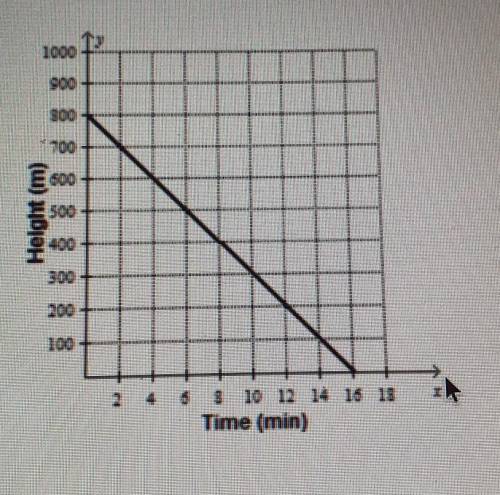
The graph below illustrates the movement of a gondola down from a mountain.
Which of these best represents the rate of change in the heights with respect to the time?
F. -50 meters per minute
G. -40 meters per minute
H. -80 meters per minute
J. -20 meters per minute
PLEASE ANSWER!!!

Answers: 2


Another question on Mathematics
Mathematics, 21.06.2019 14:10
What is the perimeter, p, of a rectangle that has a length of x + 8 and a width of y − 1? p = 2x + 2y + 18 p = 2x + 2y + 14 p = x + y − 9 p = x + y + 7
Answers: 3
Mathematics, 21.06.2019 16:20
Under normal conditions, 1.5 feet of snow will melt into 2 inches of water. during a winter season high in the mountains, 301 feet of snow fell. how many inches of water will there be when the snow melts?
Answers: 1
Mathematics, 21.06.2019 17:00
Imogene invested $8,000 in a bank account that pays 8 percent simple interest at the end of each year. her friend invested the same amount in stocks where the growth of the investment is represented as 2,000 times the square root of 2 less than the time lapsed in years. if y1 and y2 represent the amount earned in dollars and t is the time lapsed in years, which system of equations correctly represents the situation?
Answers: 1
Mathematics, 21.06.2019 17:30
Adiverr from the university of florida women’s swimming and diving team is competing in the ncaa zone b championships
Answers: 2
You know the right answer?
The graph below illustrates the movement of a gondola down from a mountain.
Which of these best rep...
Questions

Physics, 05.07.2019 03:40


Business, 05.07.2019 03:40
Mathematics, 05.07.2019 03:40


History, 05.07.2019 03:40
History, 05.07.2019 03:40

Computers and Technology, 05.07.2019 03:40

Chemistry, 05.07.2019 03:40

Business, 05.07.2019 03:40
Chemistry, 05.07.2019 03:40


