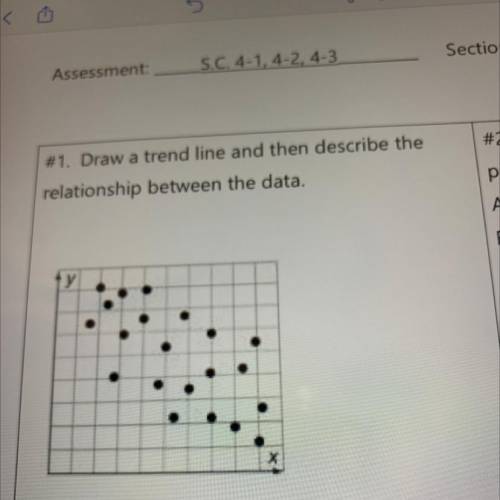
#1.Draw a trend line and then describe the
relationship between the data.
Help me answe...

Mathematics, 27.03.2021 15:50 jojojolie6505
#1.Draw a trend line and then describe the
relationship between the data.
Help me answer this question pls

Answers: 2


Another question on Mathematics
Mathematics, 21.06.2019 15:00
Simplify (a/b - b/a) times (a - a^2/a+b) a - a^2/a=b is a mixed number
Answers: 2
Mathematics, 21.06.2019 20:30
Tom is the deli manager at a grocery store. he needs to schedule employee to staff the deli department for no more that 260 person-hours per week. tom has one part-time employee who works 20 person-hours per week. each full-time employee works 40 person-hours per week. write and inequality to determine n, the number of full-time employees tom may schedule, so that his employees work on more than 260 person-hours per week. graph the solution set to this inequality.
Answers: 1
Mathematics, 21.06.2019 21:00
An account with a $250 balance accrues 2% annually. if no deposits or withdrawals are made, which graph can be used to determine approximately how many years will it take for the balance to be $282? it's e2020 ni️️as
Answers: 1
You know the right answer?
Questions


Mathematics, 29.09.2020 21:01

History, 29.09.2020 21:01


Chemistry, 29.09.2020 21:01


