
Mathematics, 27.03.2021 22:40 4presidents
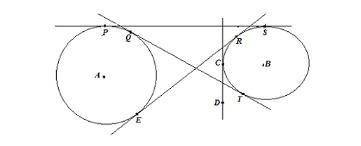
Use the image above to identify and explain the relationship between the segments and circles A and B. In your explanation, be sure to include specific vocabulary and definitions for the relationships. ER

Answers: 2


Another question on Mathematics
Mathematics, 21.06.2019 16:30
The temperature of chicken soup is 192.7°f. as it cools, the temperature of the soup decreases 2.3°f per minute. what is the temperature in degrees fahrenheit of the soup after 25 minutes? a. 27.3°f b. 57.5°f c. 135.2°f d. 250.2°f
Answers: 1
Mathematics, 21.06.2019 19:40
Graph y = -|x| + 2. click on the graph until the correct one appears.
Answers: 3
Mathematics, 21.06.2019 20:00
Someone answer asap for ! max recorded the heights of 500 male humans. he found that the heights were normally distributed around a mean of 177 centimeters. which statements about max’s data must be true? a. the median of max’s data is 250 b. more than half of the data points max recorded were 177 centimeters. c. a data point chosen at random is as likely to be above the mean as it is to be below the mean. d. every height within three standard deviations of the mean is equally likely to be chosen if a data point is selected at random.
Answers: 1
You know the right answer?
Use the image above to identify and explain the relationship between the segments and circles A and...
Questions

Mathematics, 24.06.2020 21:01


Mathematics, 24.06.2020 21:01


Mathematics, 24.06.2020 21:01
Mathematics, 24.06.2020 21:01
Mathematics, 24.06.2020 21:01


