Arm Span (inches) Height (inches)
60 62
72 74
64 66
51 55
19 25
37 39...

Mathematics, 29.03.2021 01:00 20brooklyn22
Arm Span (inches) Height (inches)
60 62
72 74
64 66
51 55
19 25
37 39
44 45
47 49
36 35
41 40
46 50
58 61
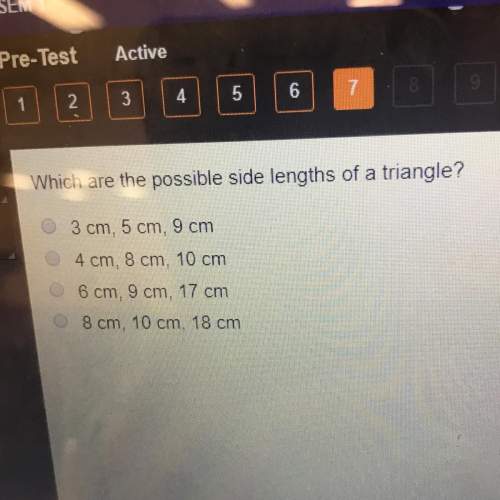
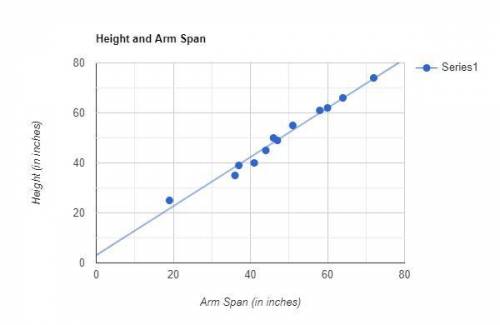
Which variable did you plot on the x-axis, and which variable did you plot on the y-axis? Explain why you assigned the variables in that way.
Write the equation of the line of best fit using the slope-intercept formula y = mx + b. Show all your work, including the points used to determine the slope and how the equation was determined.
What does the slope of the line represent within the context of your graph? What does the y-intercept represent?
Test the residuals of two other points to determine how well the line of best fit models the data.
Use the line of best fit to help you to describe the data correlation.
Using the line of best fit that you found in Part Three, Question 2, approximate how tall is a person whose arm span is 66 inches?
According to your line of best fit, what is the arm span of a 74-inch-tall person?

Answers: 2


Another question on Mathematics
Mathematics, 21.06.2019 19:00
List the sides of δrst in ascending order (shortest to longest) if: m∠r =x+28°, m∠s = 2x+16°, and m∠t = x+12
Answers: 1
Mathematics, 21.06.2019 22:30
Which of the following graphs could represent a quartic function?
Answers: 1
You know the right answer?
Questions


Biology, 22.12.2019 23:31
Biology, 22.12.2019 23:31
Mathematics, 22.12.2019 23:31

History, 22.12.2019 23:31

Advanced Placement (AP), 22.12.2019 23:31

Mathematics, 22.12.2019 23:31
Mathematics, 22.12.2019 23:31

Chemistry, 22.12.2019 23:31
Mathematics, 22.12.2019 23:31
Mathematics, 22.12.2019 23:31
History, 22.12.2019 23:31
Mathematics, 22.12.2019 23:31


