Mathematics, 29.03.2021 08:00 slpsoniaa
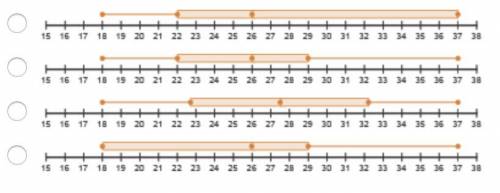
The number of bus riders was recorded on one route. The data have these values: minimum = 18, lower quartile = 22, median = 26, upper quartile = 29, and maximum = 37. Which box plot represents the data?


Answers: 3


Another question on Mathematics

Mathematics, 21.06.2019 16:00
What is the length of the unknown leg in the right triangle ?
Answers: 2

Mathematics, 21.06.2019 18:00
If f(x) = 4x – 3 and g(x) = 8x + 2, find each function value a.f[g(3)] b.g[f(5)] c.g{f[g(-4)]}
Answers: 3

Mathematics, 21.06.2019 21:30
Look at triangle wxy what is the length (in centimeters) of the side wy of the triangle?
Answers: 2

Mathematics, 22.06.2019 08:00
Bradley is preparing a presentation to show the ceo of his company. he wants to emphasize that the profits of their competitor have increased slowly over the past 16 months. the graphs below show the profit, y, of the competitor over the past 16 months. both graphs show the same information.
Answers: 2
You know the right answer?
The number of bus riders was recorded on one route. The data have these values: minimum = 18, lower...
Questions


Mathematics, 26.09.2019 01:50


Social Studies, 26.09.2019 01:50

Mathematics, 26.09.2019 01:50


English, 26.09.2019 01:50

Mathematics, 26.09.2019 01:50


Mathematics, 26.09.2019 01:50

English, 26.09.2019 01:50

History, 26.09.2019 01:50

Chemistry, 26.09.2019 01:50


Geography, 26.09.2019 01:50


