
Mathematics, 29.03.2021 08:20 theyfallfora
Do both A and B please
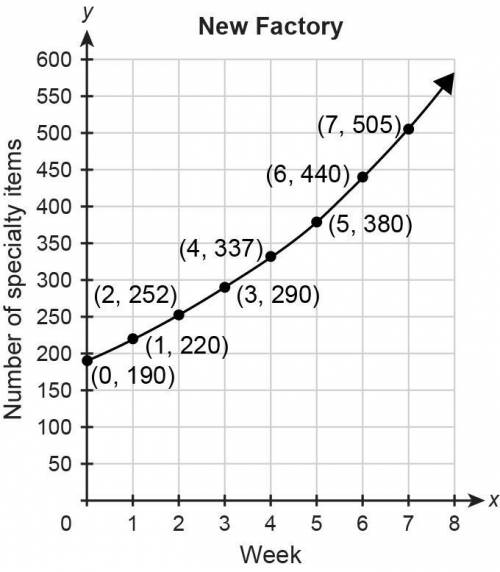
The function p(w)= 230(1.1)^w represents the number of specialty items produced at the old factory w weeks after a change in management. The graph represents the number of specialty items produced at the new factory during the same time period.
(a) During Week 0, how many more specialty items were produced at the old factory than at the new factory? Explain.
(b) Find and compare the growth rates in the weekly number of specialty items produced at each factory. Show your work.

Answers: 2


Another question on Mathematics
Mathematics, 21.06.2019 17:30
Marco has $38.43 dollars in his checking account. his checking account is linked to his amazon music account so he can buy music. the songs he purchases cost $1.29. part 1: write an expression to describe the amount of money in his checking account in relationship to the number of songs he purchases. part 2: describe what the variable represents in this situation.
Answers: 2
Mathematics, 21.06.2019 20:30
Max recorded the heights of 500 male humans. he found that the heights were normally distributed around a mean of 177 centimeters. which statements about max’s data must be true? a) the median of max’s data is 250 b) more than half of the data points max recorded were 177 centimeters. c) a data point chosen at random is as likely to be above the mean as it is to be below the mean. d) every height within three standard deviations of the mean is equally likely to be chosen if a data point is selected at random.
Answers: 2
Mathematics, 21.06.2019 21:20
Paul’s car is 18 feet long. he is making a model of his car that is 1/6 the actual size. what is the length of the model?
Answers: 1
Mathematics, 22.06.2019 01:30
Have you ever been in the middle of telling a story and had to use hand gestures or even a drawing to make your point? in algebra, if we want to illustrate or visualize a key feature of a function, sometimes we have to write the function in a different form—such as a table, graph, or equation—to determine the specific key feature we’re looking for. think about interactions with others and situations you’ve come across in your own life. how have you had to adjust or change the way you represented something based on either the concept you were trying to describe or the person you were interacting with? explain how the complexity or layout of the concept required you to change your style or presentation, or how the person’s unique learning style affected the way you presented the information.
Answers: 1
You know the right answer?
Do both A and B please
The function p(w)= 230(1.1)^w represents the number of specialty items produ...
Questions

Mathematics, 24.08.2021 03:20
Mathematics, 24.08.2021 03:20

Mathematics, 24.08.2021 03:20

Mathematics, 24.08.2021 03:20
English, 24.08.2021 03:20

Biology, 24.08.2021 03:20
Business, 24.08.2021 03:20
Mathematics, 24.08.2021 03:20


