A baker recorded the number of batches of
cookies he made on each of seven days. He
bak...

Mathematics, 30.03.2021 01:20 kellypechacekoyc1b3
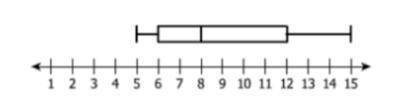
A baker recorded the number of batches of
cookies he made on each of seven days. He
baked a different number of batches of cookies
each day. This box-and-whisker plot
summarizes his data.
Number of Cookies
+
9 10 11 12 13 14 15
1 2
3
4
5
6
7
8
The baker baked 20 batches of cookies on the
eighth day. He redraws the box-and-whisker plot
to include his data. Which statement comparing
the new box-and-whisker plot to the original box-
and-whisker plot is NOT true?
A. The median increased.
B. The lower extreme increased.
C. The upper extreme increased.
D. The value of the interquartile range
increased

Answers: 1


Another question on Mathematics
Mathematics, 21.06.2019 19:00
The pyramid shown has a square base that is 24 centimeters on each side. the slant height is 16 centimeters. what is the lateral surface area?
Answers: 2
Mathematics, 21.06.2019 21:10
Patty made a name tag in the shape of a parallelogram. reilly made a rectangular name tag with the same base and height. explain how the areas of the name tags compare.
Answers: 2
Mathematics, 21.06.2019 22:30
Acampus club held a bake sale as a fund raiser, selling coffee, muffins, and bacon and eggs sandwiches. the club members charged $1 for a cup of coffee, 3$ for a muffin , and $4 for a back. and egg sandwich. they sold a total of 55 items , easing $119. of the club members sold 5 more muffins than cups of coffee, how many bacon and egg sandwiches he’s did they sell
Answers: 1
Mathematics, 21.06.2019 23:20
The graph of y=x3 is transformed as shown in the graph below. which equation represents the transformed function?
Answers: 1
You know the right answer?
Questions

Mathematics, 30.03.2020 03:29
Mathematics, 30.03.2020 03:29


English, 30.03.2020 03:30
Mathematics, 30.03.2020 03:30

Mathematics, 30.03.2020 03:30
Mathematics, 30.03.2020 03:30
English, 30.03.2020 03:30

Social Studies, 30.03.2020 03:30
Mathematics, 30.03.2020 03:30

Business, 30.03.2020 03:30
English, 30.03.2020 03:31


