
Mathematics, 30.03.2021 16:00 gabigraceberg
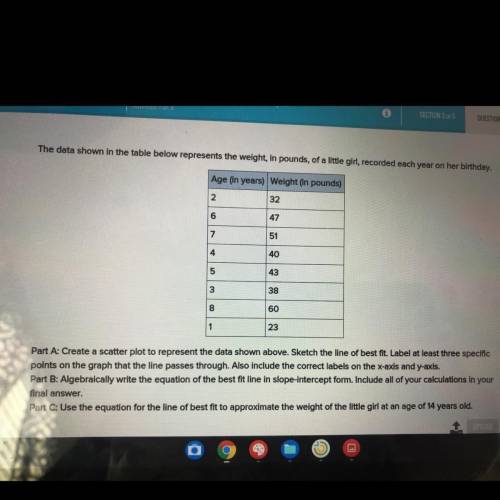
The data shown in the table below represents the weight, in pounds, of a little girl, recorded each year on her birthday.
Age (in years) Weight (in pounds)
2
32
6
09
47
7
51
40
4 5
5
43
3
38
8
00
60
1
23
Part A: Create a scatter plot to represent the data shown above. Sketch the line of best fit. Label at least three specific
points on the graph that the line passes through. Also include the correct labels on the x-axis and y-axis.
Part B: Algebraically write the equation of the best fit line in slope-intercept form. Include all of your calculations in your
final answer.
Part C: Use the equation for the line of best fit to approximate the weight of the little girl at an age of 14 years old.
Please please help me
Please help me. I will give you

Answers: 2


Another question on Mathematics
Mathematics, 21.06.2019 19:30
Look at this pattern ; 1,4,9, number 10000 belongs in this pattern . what’s the place of this number?
Answers: 3
Mathematics, 22.06.2019 01:00
X² + 4y² = 36 the major axis runs along: a) y=4x b) x-axis c) y-axis
Answers: 3
Mathematics, 22.06.2019 05:00
Sade bought 21 1/2 lb. of ground beef. he used 1/4 of the beef to make tacos and 2/3 of the remainder to make quarter-pound burgers. how many burgers did he make?
Answers: 3
You know the right answer?
The data shown in the table below represents the weight, in pounds, of a little girl, recorded each...
Questions


Health, 23.07.2019 03:20

Mathematics, 23.07.2019 03:20

English, 23.07.2019 03:20

Health, 23.07.2019 03:20
Social Studies, 23.07.2019 03:20


Biology, 23.07.2019 03:20
Mathematics, 23.07.2019 03:20


