
Mathematics, 30.03.2021 16:40 jamilamiller200
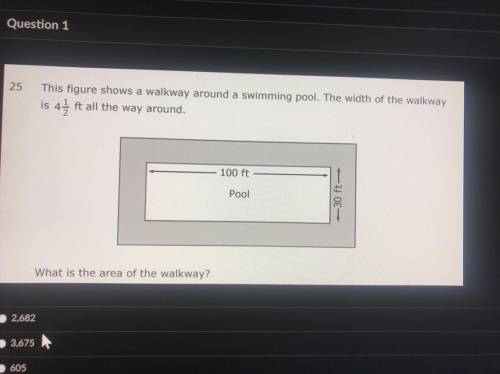
This figure shows a walkway around a swimming pool. The width of the walkway is 4 1/2 ft all the way around.

Answers: 2


Another question on Mathematics
Mathematics, 21.06.2019 22:00
Problem situation: caren is making rice and beans. she can spend no more than $10 on ingredients. she buys one bag of rice for $4.99. beans cost $0.74 per pound. how many pounds of beans, x, can she buy? inequality that represents this situation: 10≥4.99+0.74x drag each number to show if it is a solution to both the inequality and the problem situation, to the inequality only, or if it is not a solution.
Answers: 1
Mathematics, 22.06.2019 01:10
Farmers know that driving heavy equipment on wet soil compresses the soil and injures future crops. here are data on the "penetrability" of the same type of soil at two levels of compression. penetrability is a measure of how much resistance plant roots will meet when they try to grow through the soil. compressed soil 2.85 2.66 3 2.82 2.76 2.81 2.78 3.08 2.94 2.86 3.08 2.82 2.78 2.98 3.00 2.78 2.96 2.90 3.18 3.16 intermediate soil 3.17 3.37 3.1 3.40 3.38 3.14 3.18 3.26 2.96 3.02 3.54 3.36 3.18 3.12 3.86 2.92 3.46 3.44 3.62 4.26 use the data, omitting the high outlier, to give a 95% confidence interval for the decrease in penetrability of compressed soil relative to intermediate soil. compute degrees of freedom using the conservative method. interval: to
Answers: 1
Mathematics, 22.06.2019 02:30
Me answer this question: -2/3p + 1/5 - 1 + 5/6p i think the simplified expression is 1/6p - 4/5 correct me if i'm wrong, and explain it! if i have it right, just tell me. you so
Answers: 1
Mathematics, 22.06.2019 03:00
Describe how the presence of possible outliers might be identified on the following. (a) histograms gap between the first bar and the rest of bars or between the last bar and the rest of bars large group of bars to the left or right of a gap higher center bar than surrounding bars gap around the center of the histogram higher far left or right bar than surrounding bars (b) dotplots large gap around the center of the data large gap between data on the far left side or the far right side and the rest of the data large groups of data to the left or right of a gap large group of data in the center of the dotplot large group of data on the left or right of the dotplot (c) stem-and-leaf displays several empty stems in the center of the stem-and-leaf display large group of data in stems on one of the far sides of the stem-and-leaf display large group of data near a gap several empty stems after stem including the lowest values or before stem including the highest values large group of data in the center stems (d) box-and-whisker plots data within the fences placed at q1 â’ 1.5(iqr) and at q3 + 1.5(iqr) data beyond the fences placed at q1 â’ 2(iqr) and at q3 + 2(iqr) data within the fences placed at q1 â’ 2(iqr) and at q3 + 2(iqr) data beyond the fences placed at q1 â’ 1.5(iqr) and at q3 + 1.5(iqr) data beyond the fences placed at q1 â’ 1(iqr) and at q3 + 1(iqr)
Answers: 1
You know the right answer?
This figure shows a walkway around a swimming pool. The width of the walkway is 4 1/2 ft all the way...
Questions
Mathematics, 27.12.2020 23:50


History, 27.12.2020 23:50


Mathematics, 27.12.2020 23:50
Mathematics, 27.12.2020 23:50
English, 28.12.2020 01:00
Mathematics, 28.12.2020 01:00
Mathematics, 28.12.2020 01:00

Health, 28.12.2020 01:00
Mathematics, 28.12.2020 01:00
Mathematics, 28.12.2020 01:00
Health, 28.12.2020 01:00


