
Mathematics, 30.03.2021 17:30 Gheaton1889
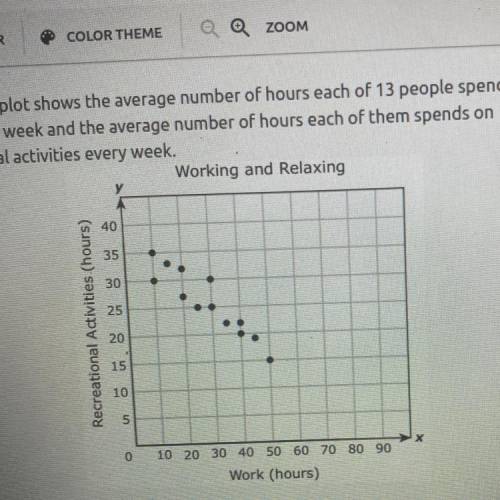
7. The scatterplot shows the average number of hours each of 13 people spends at
work every week and the average number of hours each of them spends on
recreational activities every week.
Working and Relaxing
65 h
50 h
40
35
33 h
30
25
Recreational Activities (hours)
85 h
20
15
10
CLEAR ALL
5
0
10 20 30 40 50 60 70 80 90
Work (hours)
Based on the scatterplot, what is the best prediction of the average number of hours
a person spends at work every week if that person spends an average of 10 hours on
recreational activities every week?
oh

Answers: 3


Another question on Mathematics
Mathematics, 21.06.2019 18:00
Solve this system of equations. 12x − 18y = 27 4x − 6y = 10
Answers: 1
Mathematics, 21.06.2019 20:00
Which of the following is the inverse of y = 3∧x y = 1/3∧x y = ㏒3x y = (1/3) ∧x y = ㏒ 1/3∧x
Answers: 1
Mathematics, 21.06.2019 21:00
Which expressions are equivalent to -7+3(-4e-3)? choose all answers that apply: choose all answers that apply: a -4(3e+4)? 4(3e+4) b 12e12e c none of the above
Answers: 2
Mathematics, 21.06.2019 23:30
How do you find the distance of each number from the mean
Answers: 1
You know the right answer?
7. The scatterplot shows the average number of hours each of 13 people spends at
work every week an...
Questions


Advanced Placement (AP), 11.12.2019 22:31


Chemistry, 11.12.2019 22:31
Mathematics, 11.12.2019 22:31
Mathematics, 11.12.2019 22:31


English, 11.12.2019 22:31
Mathematics, 11.12.2019 22:31
Mathematics, 11.12.2019 22:31

Mathematics, 11.12.2019 22:31


