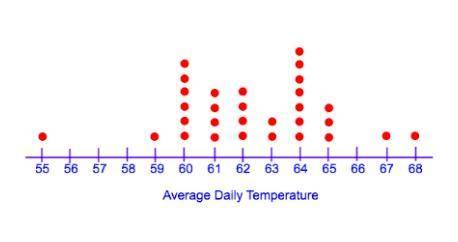
Use the dot plot. Find the sum of the interquartile range and Maximum.
...

Mathematics, 30.03.2021 19:50 meganwintergirl
Use the dot plot. Find the sum of the interquartile range and Maximum.

Answers: 1


Another question on Mathematics
Mathematics, 21.06.2019 14:40
Which system of linear inequalities is represented by the graph? !
Answers: 1
Mathematics, 21.06.2019 18:00
Mozart lenses inc. recently introduced seelites, a thinner lens for eyelasses. of a sample of 800 eyeglass wearers, 246 said they would purchases their next pair of eyeglasses with the new lenses. lenses inc. estimates that the number of people who purchase eyeglasses in a year is 1,700,000. most eyeglasses wearer buy one new pair of eyeglasses a year. what is the annual sales potential for the new lenses.
Answers: 1
Mathematics, 21.06.2019 20:30
Tom is the deli manager at a grocery store. he needs to schedule employee to staff the deli department for no more that 260 person-hours per week. tom has one part-time employee who works 20 person-hours per week. each full-time employee works 40 person-hours per week. write and inequality to determine n, the number of full-time employees tom may schedule, so that his employees work on more than 260 person-hours per week. graph the solution set to this inequality.
Answers: 1
Mathematics, 21.06.2019 21:00
Timmy uses 1 1 2 cups of sugar for every 2 gallons of lemonade he makes. how many cups of sugar would timmy use if he makes 13 gallons of lemonade?
Answers: 1
You know the right answer?
Questions

Social Studies, 04.08.2020 18:01


Chemistry, 04.08.2020 18:01

Physics, 04.08.2020 18:01
Mathematics, 04.08.2020 18:01


Business, 04.08.2020 18:01
History, 04.08.2020 18:01
Chemistry, 04.08.2020 18:01


