
Mathematics, 01.04.2021 09:00 trevorpeterson20
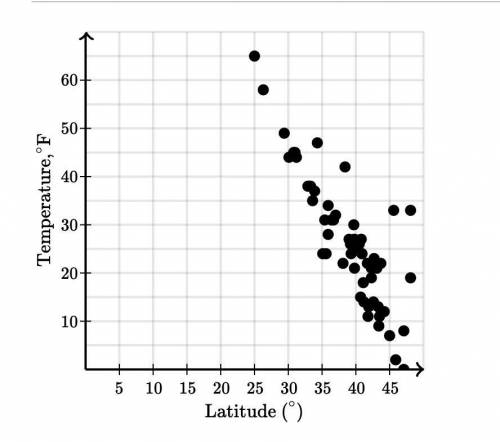
The scatter plot below shows the relationship between the latitude of cities and their average January temperature.
Which of the following is the best estimate of the average change in temperature associated with a 1-degree increase in latitude?
Choose 1
(Choice A)
-15 F
(Choice B)
−2.5 F
(Choice C)
2.5 F
(Choice D)
15 F

Answers: 3


Another question on Mathematics
Mathematics, 21.06.2019 14:30
Find a number such that if you add 8 and divide the result by 4 you will get the same answer as if you subtracted 3 from the original number and divided by 2
Answers: 3
Mathematics, 21.06.2019 19:50
On a piece of paper graft y+2> -3x-3 then determine which answer matches the graph you drew
Answers: 2
You know the right answer?
The scatter plot below shows the relationship between the latitude of cities and their average Janua...
Questions


Computers and Technology, 15.02.2020 03:16


Mathematics, 15.02.2020 03:18
Mathematics, 15.02.2020 03:18
Mathematics, 15.02.2020 03:18

Social Studies, 15.02.2020 03:18


