
Mathematics, 01.04.2021 20:20 alejandro1102
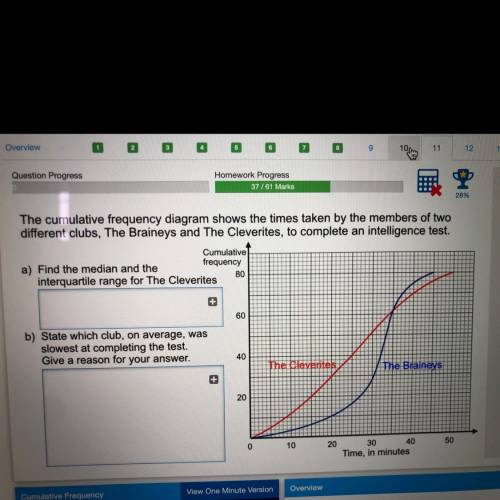
The cumulative frequency diagram shows the times taken by the members of two
different clubs, The Braineys and The Cleverites, to complete an intelligence test.
Cumulative
a) Find the median and the
frequency
interquartile range for The Cleverites
80
60
b) State which club, on average, was
slowest at completing the test.
Give a reason for your answer.
40
The Cleverites
The Braineys
20
10
20
50
30 40
Time, in minutes

Answers: 3


Another question on Mathematics
Mathematics, 21.06.2019 21:30
One astronomical unit (1 au) is about 1.496 alt tag missing. kilometers. if you wrote this number of kilometers in regular decimal notation (for example, 528 and 3,459 are written in regular decimal notation), how many zeros would your number have?
Answers: 1
Mathematics, 21.06.2019 23:00
Apoll is being conducted at a mall nothingto obtain a sample of the population of an entire country. what is the frame for this type of​ sampling? who would be excluded from the survey and how might this affect the results of the​ survey? what is the frame for this type of​ sampling? a. the frame is people who need new clothes. b. the frame is people who shop at the mall. c. the frame is people who like to shop. d. the frame is the entire population of the country. who would be excluded from the survey and how might this affect the results of the​ survey? a. any person that does not need new clothes is excluded. this could result in sampling bias due to undercoverage. b. any person who does not shop at the mall is excluded. this could result in sampling bias due to undercoverage. c. any person who does not shop at the mall is excluded. this could result in nonresponse bias due to people not participating in the poll. d. there is nobody that is being excluded from the survey.
Answers: 3
Mathematics, 22.06.2019 01:30
Asample of 200 rom computer chips was selected on each of 30 consecutive days, and the number of nonconforming chips on each day was as follows: the data has been given so that it can be copied into r as a vector. non.conforming = c(10, 15, 21, 19, 34, 16, 5, 24, 8, 21, 32, 14, 14, 19, 18, 20, 12, 23, 10, 19, 20, 18, 13, 26, 33, 14, 12, 21, 12, 27) #construct a p chart by using the following code. you will need to enter your values for pbar, lcl and ucl. pbar = lcl = ucl = plot(non.conforming/200, ylim = c(0,.5)) abline(h = pbar, lty = 2) abline(h = lcl, lty = 3) abline(h = ucl, lty = 3)
Answers: 3
Mathematics, 22.06.2019 02:30
In one month jillian made 36 local phone calls and 20 long-distance calls what was her ratio of local calls to long-distance calls for that month?
Answers: 1
You know the right answer?
The cumulative frequency diagram shows the times taken by the members of two
different clubs, The B...
Questions


Biology, 19.12.2020 06:00

Mathematics, 19.12.2020 06:00

Chemistry, 19.12.2020 06:00
Mathematics, 19.12.2020 06:00
Biology, 19.12.2020 06:00

Health, 19.12.2020 06:00
Mathematics, 19.12.2020 06:00
Mathematics, 19.12.2020 06:00
Chemistry, 19.12.2020 06:00
Mathematics, 19.12.2020 06:00
Mathematics, 19.12.2020 06:00


