
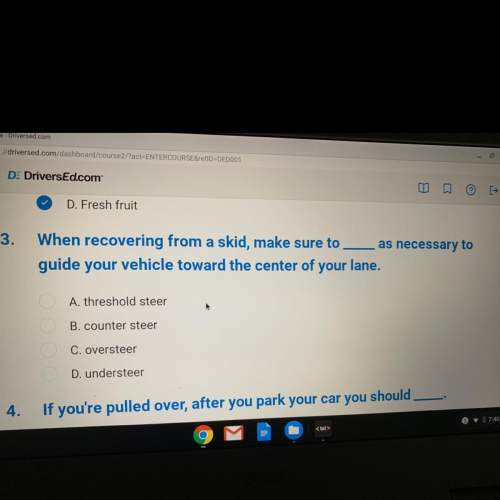
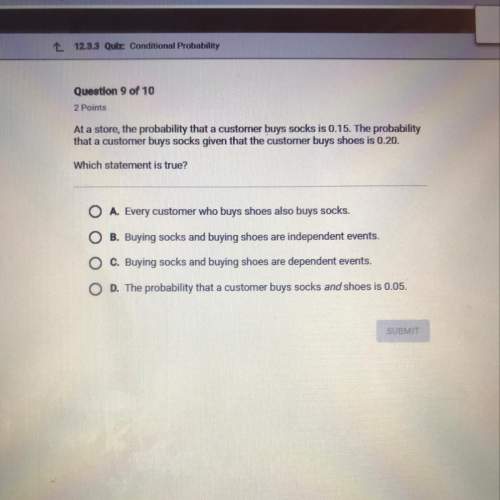
Mathematics, 02.04.2021 06:20 kev71
The graph depicts IQ scores of adults, and those scores are normally distributed with a mean of 100 and a standard
deviation of 15. Find the probability that a member selected at random is from the shaded area of the graph.
+
75
60
80
85
95
130
65
70
90
100
110
113
125
135
105
120
140,145
0.7745
0.7619
0.7303
0.7938

Answers: 3


Another question on Mathematics
Mathematics, 21.06.2019 14:30
Which sentence describes why polygon mnop is congruent to polygon jklp? a. polygon jklp maps to polygon mnop through a translation. b. polygon jklp maps to polygon mnop through a rotation. c. polygon jklp maps to polygon mnop through a dilation. d. polygon jklp maps to polygon mnop through a stretch.
Answers: 2
Mathematics, 21.06.2019 20:50
These tables represent a quadratic function with a vertex at (0, -1). what is the average rate of change for the interval from x = 9 to x = 10?
Answers: 2
Mathematics, 21.06.2019 21:30
Awater truck is filling a swimming pool. the equation that represents this relationship is y=19.75x where y is the number of gallons of water in the pool and x is the number of minutes the truck has been filling the pool.
Answers: 1
You know the right answer?
The graph depicts IQ scores of adults, and those scores are normally distributed with a mean of 100...
Questions


Computers and Technology, 12.07.2019 07:30

Mathematics, 12.07.2019 07:30
History, 12.07.2019 07:30
History, 12.07.2019 07:30


