
Mathematics, 02.04.2021 16:50 Amholloway13
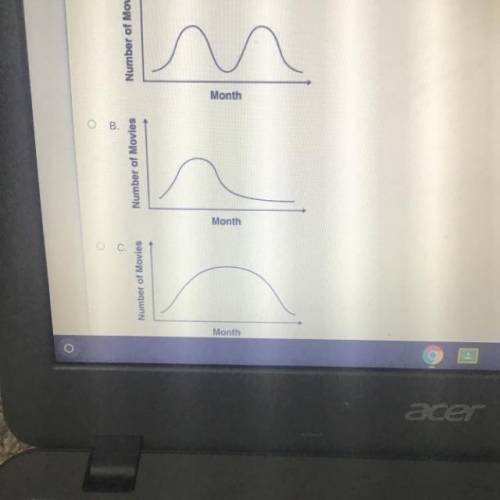
The table displays the number of movies a family watched per month over a one year period
Jan-1
Feb-2
Mar-2
Apr-3
May-4
Jun-6
Jul-7
Aug-4
Sep-3
Oct-2
Nov-2
Dec-1
Which curve most resembles the distribution of this data?

Answers: 3


Another question on Mathematics
Mathematics, 21.06.2019 19:00
Me asap on # : explain how factoring a trinomial, ax^2+ bx+ c, when a does not equal 1 different from factoring a trinomial when a = 1.
Answers: 2
Mathematics, 21.06.2019 20:00
Seymour is twice as old as cassandra. if 16 is added to cassandra’s age and 16 is subtracted from seymour’s age, their ages become equal. what are their present ages? show !
Answers: 1
Mathematics, 21.06.2019 23:40
Which set of side lengths form a right side? a) 3ft,6ft,5ft b)50 in,48in,14in c)53m,48m,24m d)8cm,17cm,14cm
Answers: 2
Mathematics, 22.06.2019 04:00
Maria has $10,000 to invest in two accounts.he decides to invest one part in an account with 5% interest and the rest in an account with 8% interest. at the end of the year he has earned $702,50 in interest.¿how much did maria invest in the 8% account?
Answers: 2
You know the right answer?
The table displays the number of movies a family watched per month over a one year period
Jan-1
Questions

Arts, 03.09.2021 02:40
Mathematics, 03.09.2021 02:40

Mathematics, 03.09.2021 02:40

Mathematics, 03.09.2021 02:40

Biology, 03.09.2021 02:40


Mathematics, 03.09.2021 02:50


Advanced Placement (AP), 03.09.2021 02:50

Social Studies, 03.09.2021 02:50
Mathematics, 03.09.2021 02:50


