
Mathematics, 02.04.2021 20:20 promathninja20
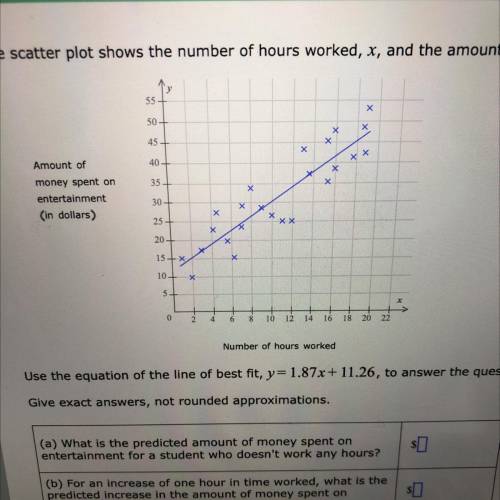
The scatter plot shows the number of hours worked, x, and the amount of money spent on entertainment, y, by each of 24 studentS
Number of hours worked
Use the equation of the line of best fit, y=1.87x+11.26, to answer the questions below,
Give exact answers, not rounded approximations,
(a) What is the predicted amount of money spent on
entertainment for a student who doesn't work any hours?
(b) For an increase of one hour in time worked, what is the
predicted increase in the amount of money spent on
entertainment?
(c) What is the predicted amount of money spent on
entertainment for a student who works 8 hours?

Answers: 1


Another question on Mathematics
Mathematics, 21.06.2019 17:00
Evaluate the expression for the given value of the variable 2×(c2-5) for c=4
Answers: 1
Mathematics, 22.06.2019 03:30
Agame has a rectangular board with an area of 44 in2. there is a square hole near the top of the game board in which you must not toss in a bean bag. the square has side lengths of 3 in. what is the probability of not tossing the bag through the hole? a)9/44 b)3/9 c)3/44 d)35/44
Answers: 2
Mathematics, 22.06.2019 05:00
Perry angelo is planning to open a restaurant. he has the resources to produce and sell either hamburgers or pizzas. so he does some research and finds that the new location has a good demand for pizza. he hires cooks, wait staff, and an accounts person for his new pizzeria. he also arranges for materials such as pizza ingredients and pizza boxes. determine three factors affecting perry's cost of making pizza. write down the name of the factors and their instances in this scenario.
Answers: 3
Mathematics, 22.06.2019 08:00
Jose correctly answered 80% of the questions on a language arts quiz. if he answered 16 questions correctly, how many questions were on the language arts quiz?
Answers: 1
You know the right answer?
The scatter plot shows the number of hours worked, x, and the amount of money spent on entertainment...
Questions

Geography, 04.01.2020 20:31
Mathematics, 04.01.2020 20:31


Biology, 04.01.2020 20:31
Mathematics, 04.01.2020 20:31
Mathematics, 04.01.2020 20:31

Health, 04.01.2020 20:31

Mathematics, 04.01.2020 20:31


