Which box plot matches the data set?
34, 36, 41, 45, 49, 50, 51, 52, 56, 59
For this d...

Mathematics, 03.04.2021 21:40 electronia
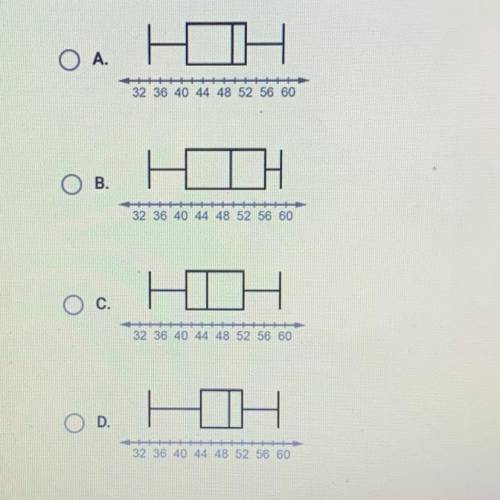
Which box plot matches the data set?
34, 36, 41, 45, 49, 50, 51, 52, 56, 59
For this data set, the first quartile is 41, the median is 49.5, and the third quartile is 52.

Answers: 1


Another question on Mathematics
Mathematics, 21.06.2019 17:10
The frequency table shows a set of data collected by a doctor for adult patients who were diagnosed with a strain of influenza. patients with influenza age range number of sick patients 25 to 29 30 to 34 35 to 39 40 to 45 which dot plot could represent the same data as the frequency table? patients with flu
Answers: 2
Mathematics, 21.06.2019 18:30
[10 points, algebra 2-simplifying complex fractions]according to my answer key the restrictions are -1 and 4. but why not positive 1?
Answers: 1
Mathematics, 22.06.2019 01:30
12.0 million metric tons of beef produced annually in the u.s. out if 65.1 mikkion metric tons of produced annually worldwide
Answers: 1
Mathematics, 22.06.2019 01:30
When solving a logarithm equation, how do you find the missing variable ?
Answers: 2
You know the right answer?
Questions

Mathematics, 30.11.2020 21:40
Mathematics, 30.11.2020 21:40


Biology, 30.11.2020 21:40

Computers and Technology, 30.11.2020 21:40

Mathematics, 30.11.2020 21:40


