
Mathematics, 05.04.2021 09:10 starfox5454
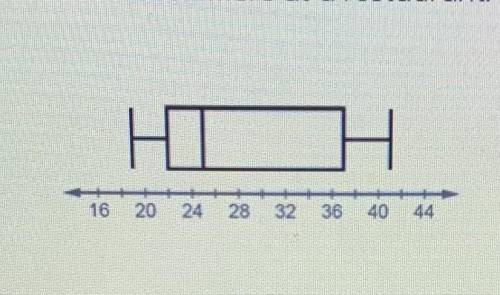
The box plot summarizes the data for the number of minutes it took to serve customers at a restaurant.
Use the box plot to complete each statement.
1. What is the shortest time it took to serve a customer?
2. What is the longest time it took to serve a customer?
3. What is the median time it took to serve a customer?
4. What is the first quartile of the restaurant service times?
5. What is the third quartile of the restaurant service times?

Answers: 1


Another question on Mathematics
Mathematics, 21.06.2019 21:30
Tom can paint the fence in 12 hours, but if he works together with a friend they can finish the job in 8 hours. how long would it take for his friend to paint this fence alone?
Answers: 1
Mathematics, 21.06.2019 23:00
How many heads would you expect if you flipped a coin twice? first, fill in the table below with the correct probabilities. hint: the sample space for flipping a coin twice is {hh, ht, th, tt}. a = b = c =
Answers: 3
Mathematics, 22.06.2019 01:00
Is the ordered pair (-10, 7) a solution to the equation y = 17 – x? yes or no
Answers: 1
You know the right answer?
The box plot summarizes the data for the number of minutes it took to serve customers at a restauran...
Questions


Physics, 08.12.2021 05:30
Mathematics, 08.12.2021 05:30

Biology, 08.12.2021 05:30
Mathematics, 08.12.2021 05:30

Health, 08.12.2021 05:30
Mathematics, 08.12.2021 05:30

History, 08.12.2021 05:30
History, 08.12.2021 05:30

History, 08.12.2021 05:30
English, 08.12.2021 05:30


