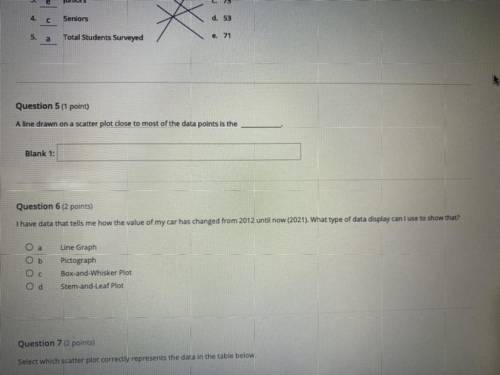
Question 5 (1 point)
A line drawn on a scatter plot close to most of the data points is the
B...

Mathematics, 05.04.2021 17:00 anonymous9723
Question 5 (1 point)
A line drawn on a scatter plot close to most of the data points is the
Blank 1:
Question 6 (2 points)
I have data that tells me how the value of my car has changed from 2012 until now (2021). What type of data display can I use to show that?
O a
b
Line Graph
Pictograph
Box-and-Whisker
PLS HELP WITU QUESTION 5 AND 6666666PLS URGENT
Stem-and-Leaf Plot
ос
Od


Answers: 1


Another question on Mathematics


Mathematics, 21.06.2019 23:00
Which of the following scenarios demonstrates an exponential decay
Answers: 1

Mathematics, 22.06.2019 03:00
The algebraic expression shown below is missing two whole number constants. determine the constants so that the expression simplified to 14x + 11 4x + 8(x + + + 2x
Answers: 1

Mathematics, 22.06.2019 04:30
Draw a geometric diagram of this scenario using two parallel lines and one transversal. (remember that a transversal is a line which cuts across parallel lines.) label the angles, parallel lines, and transversal as indicated in the diagram above.
Answers: 2
You know the right answer?
Questions


Computers and Technology, 27.11.2019 05:31


