
Mathematics, 05.04.2021 21:10 kaylinrebecca
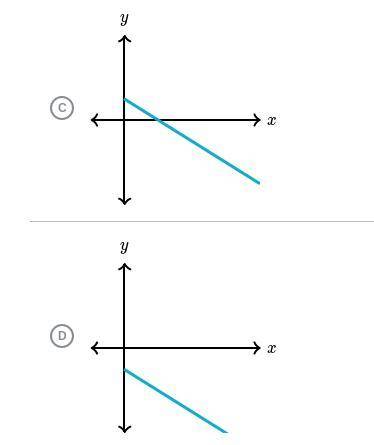
A charity organization had a fundraiser where each ticket was sold for a fixed price. After selling 200 tickets, they had a net profit of $12,000. They had to sell a few tickets just to cover necessary production costs of $1,200
Let y represent the net profit (in dollars) when they have sold x tickets.
Which of the following could be the graph of the relationship?
Choose 1


Answers: 2


Another question on Mathematics
Mathematics, 21.06.2019 16:40
Which region represents the solution to the given system of inequalities? |-0.5x+y23 | 1.5x+ys-1 5 4 -3 -2 -1 1 2 3 4
Answers: 1
Mathematics, 21.06.2019 17:00
Alonso walked with his friend andy one day, and wanted to compare their speeds. alonso walked 3 miles in one hour, and andy walked 2 miles in 2 hours. complete the table to graph the relationship for each person.
Answers: 3
Mathematics, 21.06.2019 18:10
If a || b and b | y, then ? a) x || y. b) x | a. c) a | y. d) a || y.
Answers: 1
Mathematics, 21.06.2019 21:20
In 2009, there were 1570 bears in a wildlife refuge. in 2010, the population had increased to approximately 1884 bears. if this trend continues and the bear population is increasing exponentially, how many bears will there be in 2018?
Answers: 2
You know the right answer?
A charity organization had a fundraiser where each ticket was sold for a fixed price. After selling...
Questions
Mathematics, 13.09.2019 01:10
Mathematics, 13.09.2019 01:10
Mathematics, 13.09.2019 01:10

Mathematics, 13.09.2019 01:10


History, 13.09.2019 01:10
Mathematics, 13.09.2019 01:10

Chemistry, 13.09.2019 01:10
English, 13.09.2019 01:10
Mathematics, 13.09.2019 01:10
Mathematics, 13.09.2019 01:10
Mathematics, 13.09.2019 01:10


