
Mathematics, 05.04.2021 23:30 leo4687
A research company desires to know the mean consumption of meat per week among males over age 43. A sample of 1384 males over age 43 was drawn and the mean meat consumption was 3 pounds. Assume that the population standard deviation is known to be 1.3 pounds. Construct the 99% confidence interval for the mean consumption of meat among males over age 43. Round your answers to one decimal place.

Answers: 2
 level, that is the subtraction of 1 by the confidence interval divided by 2. So:
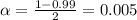
 .
. , so Z = 2.575.
 is the standard deviation of the population and n is the size of the sample.
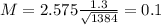


Another question on Mathematics
Mathematics, 21.06.2019 22:30
The party planning committee has to determine the number of tables needed for an upcoming event. if a square table can fit 8 people and a round table can fit 6 people, the equation 150 = 8x + 6y represents the number of each type of table needed for 150 people.
Answers: 1
Mathematics, 21.06.2019 23:00
Each of the following data sets has a mean of x = 10. (i) 8 9 10 11 12 (ii) 7 9 10 11 13 (iii) 7 8 10 12 13 (a) without doing any computations, order the data sets according to increasing value of standard deviations. (i), (iii), (ii) (ii), (i), (iii) (iii), (i), (ii) (iii), (ii), (i) (i), (ii), (iii) (ii), (iii), (i) (b) why do you expect the difference in standard deviations between data sets (i) and (ii) to be greater than the difference in standard deviations between data sets (ii) and (iii)? hint: consider how much the data in the respective sets differ from the mean. the data change between data sets (i) and (ii) increased the squared difference îł(x - x)2 by more than data sets (ii) and (iii). the data change between data sets (ii) and (iii) increased the squared difference îł(x - x)2 by more than data sets (i) and (ii). the data change between data sets (i) and (ii) decreased the squared difference îł(x - x)2 by more than data sets (ii) and (iii). none of the above
Answers: 2
Mathematics, 21.06.2019 23:00
Eric drove 275 miles in 5 hours. at the same rate how long would it take him to drive 495 miles?
Answers: 2
Mathematics, 21.06.2019 23:40
The frequency table shows the results of a survey asking people how many hours they spend online per week. on a piece of paper, draw a histogram to represent the data. then determine which answer choice matches the histogram you drew. in order here is the.. hours online: 0-3, 4-7, 8-11, 12-15, and 16-19. frequency: 5, 8, 10, 8, 7 answer for the question is in the picture! : )
Answers: 2
You know the right answer?
A research company desires to know the mean consumption of meat per week among males over age 43. A...
Questions


English, 28.06.2019 09:30
History, 28.06.2019 09:30
Social Studies, 28.06.2019 09:30

Health, 28.06.2019 09:30
Health, 28.06.2019 09:30


