Mathematics, 06.04.2021 01:40 Arealbot
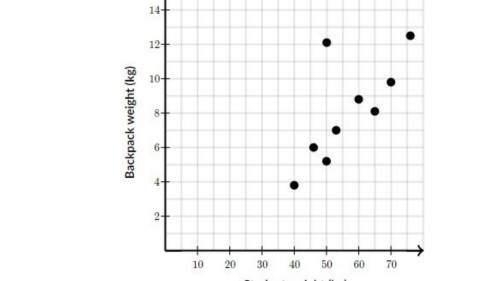
The scatter plot shows the relationship between backpack weight and student weight. Which statement describes the data shown in the scatter plot?
A) A potential outlier at (12, 50).
B) A potential outlier at (50, 12).
C) A cluster between a student weight of 40 kg to 70 kg.
D) A cluster between a backpack weight of 4 kg to 12 k


Answers: 2


Another question on Mathematics

Mathematics, 21.06.2019 14:10
Students are given 3 minutes for each multiple-choice question and 5 minutes for each free-response question on a test. there are 15 questions on the test, and students are given 51 minutes to take it.how many multiple-choice questions are on the test?
Answers: 1

Mathematics, 21.06.2019 14:10
Apackage of bacon holds 15 strips of bacon. the pancake house uses 17 packages of bacon in the morning and 21 packages in the afternoon. how many more strips were used in the afternoon than the morning?
Answers: 1

Mathematics, 21.06.2019 17:20
Read the equations in the table below. then drag a description of the situation and a table to represent each equation. indicate whether each of the relationships is proportional or non-proportional.
Answers: 1

Mathematics, 21.06.2019 18:00
Need on this geometry question. explain how you did it.
Answers: 1
You know the right answer?
The scatter plot shows the relationship between backpack weight and student weight. Which statement...
Questions

Biology, 18.03.2020 01:59

Chemistry, 18.03.2020 01:59


Social Studies, 18.03.2020 01:59

Mathematics, 18.03.2020 01:59


History, 18.03.2020 01:59


Chemistry, 18.03.2020 02:00

Mathematics, 18.03.2020 02:00

Mathematics, 18.03.2020 02:00

History, 18.03.2020 02:00


