
Mathematics, 06.04.2021 22:20 jay0630
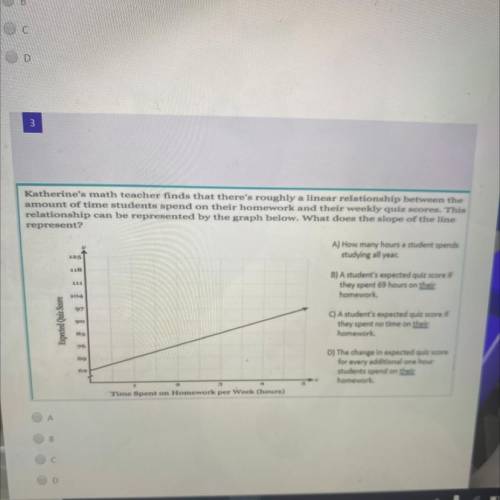
Katherine's math teacher finds that there's roughly a linear relationship between the
amount of time students spend on their homework and their weekly quiz scores. This
relationship can be represented by the graph below. What does the slope of the line
represent?
A) How many hours a student spends
studying all year.
B) A student's expected quiz score if
they spent 69 hours on their
homework.
195
118
111
104
07
Expected Quiz Score
90
C) A student's expected quiz score if
they spent no time on their
homework.
83
76
69
D) The change in expected quiz score
for every additional one hour
students spend on their
homework.
63
Time Spent on Homework per week (hours)

Answers: 3


Another question on Mathematics
Mathematics, 21.06.2019 16:30
What is the difference between regular convex and concave polygons
Answers: 1
Mathematics, 21.06.2019 19:00
What is the best way to answer questions with a x expression in the question. for example 3x + 10x=?
Answers: 1
Mathematics, 21.06.2019 20:30
The function v(r)=4/3pir^3 can be used to find the volume of air inside a basketball given its radius. what does v(r) represent
Answers: 1
Mathematics, 21.06.2019 23:30
Annabelle's homework is 75% it took her three hours how long should she estimate it will take her to complete her homework.
Answers: 1
You know the right answer?
Katherine's math teacher finds that there's roughly a linear relationship between the
amount of tim...
Questions

History, 19.12.2019 18:31
Mathematics, 19.12.2019 18:31

Spanish, 19.12.2019 18:31
Mathematics, 19.12.2019 18:31
Mathematics, 19.12.2019 18:31


Health, 19.12.2019 18:31


Social Studies, 19.12.2019 18:31
Mathematics, 19.12.2019 18:31

Computers and Technology, 19.12.2019 18:31


